
Executive Overview
The landscape of B2B software mergers and acquisitions (M&A) is currently defined by a profound, headline-skewing paradox. According to Kroll’s Summer 2026 Global Software Sector Update—a comprehensive 20-page market pulse tracking public comps and transaction data through June 30, 2026—the macroeconomic indicators point to a robust, almost historic recovery. On paper, deal volume is tracking toward the second-highest year on record, private M&A EBITDA multiples have jumped by an impressive 25%, and public revenue multiples have ticked upward for the first time in several quarters.
Yet, beneath the glossy veneer of aggregate metrics lies a deeply fragmented reality. A closer inspection of the data reveals that the modern software M&A "recovery" is heavily distorted by a single, colossal market anomaly: SpaceX’s acquisition of Cursor for a staggering $60 billion during the first half of the year. Strip away this transaction, and the broader software deal economy presents a vastly different picture—one characterized by near-record-low aggregate deal values, severe valuation discrepancies between subsectors with identical growth-margin profiles, and an intensifying public market preference for hyper-growth over disciplined profitability.
For founders, private equity sponsors, and corporate development executives navigating the $10M to $100M ARR bracket, Kroll’s latest dataset offers both a reality check and a strategic playbook. Scale alone is no longer a guaranteed passport to premium valuations; instead, strategic positioning, revenue durability, and the perceived resilience of a category against AI agent displacement now dictate market pricing.
Detailed Chronology & Market Dynamics
To understand how the B2B software market reached its current juncture in mid-2026, it is necessary to retrace the trajectory of software valuations over the past half-decade. The era of loose monetary policy in 2021 pushed aggregate M&A deal values to an astronomical $429 billion, breeding an environment where growth at all costs was universally rewarded. The subsequent macroeconomic tightening of 2022 through 2024 brought a severe contraction, compressing public and private multiples alike as investors re-anchored on fiscal discipline, efficiency, and the Rule of 40.
By 2025, deal counts rebounded significantly, hitting a record 2,939 transactions as private equity firms and cash-rich strategics began deploying pent-up capital. However, transaction values remained relatively restrained.
The first half of 2026 disrupted this steady, if cautious, normalization. Annualized software M&A volume for 2026 is currently pacing at approximately 2,672 transactions—the second-highest tally in historical tracking. Yet, the total announced deal value is projected at roughly $240 billion, a figure entirely warped by upstream mega-deals. Specifically, SpaceX’s acquisition of Cursor injected $60 billion into the H1 totals. Because Kroll’s methodology annualizes first-half figures, this single transaction accounts for a massive $120 billion of the projected $240 billion annual sum.
Without Cursor, annualized 2026 deal value plummets to approximately $120 billion, ranking it among the lowest aggregate liquidity totals on record outside of deep cyclical troughs. In Q2 alone, Cursor accounted for a staggering 64% of total software deal value. Kroll notes this as the most extreme single-deal concentration observed across a decade of tracking, eclipsing the previous concentration record set in Q2 2022 when Broadcom’s acquisition of VMware and Intercontinental Exchange’s purchase of Black Knight combined for 50% of quarterly deal volume.
Supporting Context & Metrics: Five Critical Takeaways
A granular analysis of the Kroll Summer 2026 report yields five fundamental insights that decode the current pricing mechanisms of the software sector.
1. Record Deal Counts, Near-Record-Low Deal Dollars
The disconnect between transaction frequency and total capital deployment explains a common frustration among mid-market founders. Companies generating between $10M and $50M in ARR frequently find their investment bankers securing numerous introductory meetings, yet failing to convert those dialogues into binding term sheets. The aggregate capital pool is contracting even as corporate buyers execute high volumes of bolt-on acquisitions. Strategic acquirers are hunting for targeted capabilities rather than writing broad-market programmatic checks, leaving the vast majority of mid-sized venture-backed startups navigating a highly selective liquidity window.
2. The Subsector Multiple Gap Defies the Rule of 40
One of the most eye-opening disclosures in the Kroll update is the growing decoupling between traditional valuation benchmarks—such as the Rule of 40—and actual enterprise value-to-revenue (EV/CY26) multiples across subsectors. Historically, software companies with identical growth rates and EBITDA margins commanded roughly equivalent valuations. In 2026, that framework has fractured.
- Engineering vs. Human Capital Management (HCM): Both sectors boast an identical Rule of 40 score of 46%. Yet, Engineering software trades at a median EV multiple of 5.2x, while HCM commands just 3.0x—representing a dramatic 73% premium for the exact same numerical combination of growth and profitability.
- Collaboration & Productivity vs. Vertical Software: Both run a 42% Rule of 40, yet Vertical Software commands a 3.7x multiple compared to Collaboration’s 3.1x.
- Marketing vs. Cyber Security: Both sit at a 38% Rule of 40 score, yet Marketing languishes at 2.1x while Cyber Security commands a robust 5.2x.
Industry analysts point to two primary drivers for this divergence. The first is revenue durability and switching costs: Engineering buckets comprise entrenched players like Autodesk, Cadence, and Synopsys, where multi-decade migration friction and Computer-Aided Design (CAD) stickiness virtually eliminate churn. Conversely, HCM and payroll systems, while sticky, operate in increasingly commoditized and fiercely contested markets.
The second, more forward-looking driver is AI agent exposure. Categories like Customer Experience (1.8x) and Marketing (2.1x) face acute downward valuation pressure because buyers increasingly view seat-based workflows in these domains as directly automatable by autonomous AI agents. Meanwhile, foundational systems of record—such as ERP and supply chain management, which trade at a lofty 6.5x—represent the indispensable data reservoirs that AI agents require to operate.

3. The Growth Cliff Steeper; Margin Compression Plateaus
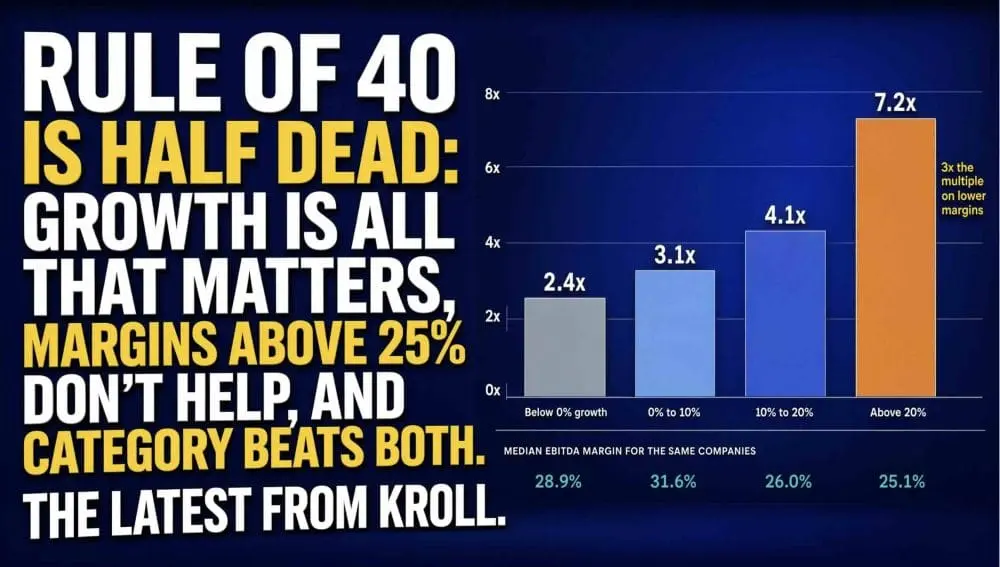
Public market data underscores a ruthless bifurcation based on top-line expansion. Public EV/CY26 revenue multiples scale dramatically with growth velocity:
- Negative Growth (Shrinking): 2.4x median revenue multiple
- 0% to 10% Growth: 3.0x median revenue multiple
- 10% to 20% Growth: 4.7x median revenue multiple
- 20%+ Growth: 7.2x median revenue multiple
Crucially, median EBITDA margins across these same four brackets remain virtually flat, hovering between 25.1% and 31.6%, with top-tier growth companies showing slightly lower median margins than their slower-growing peers. This indicates that operational profitability has officially transitioned from a market differentiator to baseline table stakes. Pushing EBITDA margins from 25% to 35% no longer moves the valuation needle; scaling top-line growth across the 20% threshold remains the single most lucrative lever for multiple expansion.
4. Strategic Acquisition Outpaces Public Valuations
Public markets spent the 12 months leading up to June 2026 punishing software equities. Median stock performance across major segments registered steep double-digit declines: Financial & Accounting dropped 50.4%, HCM fell 42.3%, Marketing declined 40.8%, Vertical Software tumbled 38.4%, and Engineering dropped 35.6%. Infrastructure stood alone as the sole positive public sector, rising 26.8%.
In sharp contrast, private strategic M&A valuations surged. Median EV/LTM revenue for strategic acquisitions in H1 2026 hit 6.0x—approaching the 2021 peak of 6.2x and towering far above the ten-year historical average of 4.7x. Private EBITDA multiples climbed 25% to reach 20.2x. Corporate acquirers, recognizing their inability to organically build native AI architectures and proprietary data moats fast enough, are aggressively paying nearly double the valuations supported by public equity markets or private equity LBO models.
5. Positioning Trumps Scale
Kroll’s breakdown of precedent EBITDA multiples by revenue size shatters the conventional wisdom surrounding corporate scale. For companies with under $100M in revenue, the median EBITDA multiple sits at 16.1x (with a top-quartile reading of 22.9x). For companies exceeding $100M in revenue, the median edges up only marginally to 17.3x (a mere 7% scale premium).
However, the dispersion within each size tier is immense. Moving from the first quartile to the third quartile within the sub-$100M cohort yields a 100% valuation uplift (from 11.5x to 22.9x). Furthermore, revenue multiples for smaller companies under $25M and mid-sized firms between $25M and $100M expanded during H1 2026, while multiples for enterprises exceeding $100M contracted slightly. The market is actively rewarding specialized, highly defensible business models down-market over sheer revenue mass.
Official Industry Perspectives
Commenting on the structural shifts captured in the mid-year report, financial restructuring and valuation experts emphasize that the software sector is undergoing a permanent structural re-rating rather than a cyclical dip.
"We are witnessing the end of generalized software investing," notes one prominent enterprise software investment banker. "Capital is no longer flowing downstream simply because a company possesses SaaS metrics. Acquirers and public markets are aggressively paying for non-replicable data assets and architectural positioning that survives—and thrives—in an agentic AI workflow. If your software can be bypassed by an LLM orchestration layer in eighteen months, your valuation multiple is heading toward zero, regardless of your current Rule of 40 score."
Private equity sponsors similarly point out that the traditional playbook of operational cost-cutting has reached diminishing returns. With baseline EBITDA margins firmly established around 25% across the industry, further margin expansion yields negligible valuation credit without concurrent, durable top-line acceleration.
Future Outlook
As the software industry looks toward the close of 2026 and into 2027, several clear strategic imperatives emerge for founders, executives, and investors:
- Category Framing is an Executive Priority: Because subsector multiples no longer track cleanly with the Rule of 40, positioning a company within a resilient, high-durable comp set (such as essential engineering systems or core data architectures) is worth more than several percentage points of organic margin improvement.
- AI Integration Must Transcend Feature Status: Surface-level AI wrappers are being heavily discounted by strategic buyers. To command the 6.0x+ revenue multiples currently paid by corporate acquirers, software providers must embed proprietary workflows and unique proprietary datasets that cannot be easily replicated by foundational model providers.
- Growth Remains King: While fiscal discipline protected software companies during the 2022–2024 downturn, public and private markets have unequivocally signaled that profitability is now a prerequisite, not a differentiator. Crossing the 20% growth threshold remains the definitive catalyst for unlocking premium valuation multiples.
- Embrace Strategic M&A Readiness: With strategic buyers paying a massive premium over public market valuations to acquire emerging capabilities, maintaining an active corporate development posture and clean financial architecture is often a more lucrative exit path than pursuing a challenging public listing in a skittish equity market.
Ultimately, Kroll’s Summer 2026 Global Software Sector Update confirms that the software industry has emerged from its post-2021 hangover, but into a starkly different operating theater. In this new era, generic SaaS metrics have taken a back seat to architectural defensibility, AI workflow integration, and precise market positioning.