

Executive Overview
For over a decade, venture capital and B2B SaaS operators relied on a standardized framework of benchmarks. Metrics such as triple-triple-double-double growth trajectories, 80% baseline gross margins, and predictable revenue decay curves served as the gospel truth for founders and institutional investors alike.
That playbook is officially obsolete.
ICONIQ has released The Pacesetter Index, a forward-looking data set that replaces their legacy Enterprise Five Scorecard. Built by aggregating financial and operating data from top public software companies alongside ICONIQ’s elite private venture and growth portfolios spanning 2024 through Q2 2026, the index establishes a radically new baseline.
Crucially, The Pacesetter Index does not present a broad market benchmark. It is intentionally exclusionary: it samples only those companies demonstrating top-quartile revenue growth over the past three years that are simultaneously classified as AI-native or AI-driven.
By filtering for these outliers, ICONIQ has illuminated a new class of hyper-growth enterprises. The numbers are staggering—featuring triple-digit medians at $100M+ ARR, compressed gross margins early on that rapidly scale later, and astronomical revenue-per-employee efficiencies driven by AI agents and automation. For modern founders, operators, and board members, understanding this index is no longer optional; it is essential preparation for navigating a market where capital is deployed against these newly minted standards.
Detailed Chronology: The Evolution of Software Benchmarks
To fully appreciate the gravity of the Pacesetter Index, one must examine how market conditions have shifted from the post-2010 SaaS boom to the AI-native reality of 2026.
The Legacy SaaS Era (2010–2022)
During the preceding decade, venture capital was heavily guided by predictable unit economics. Software companies derived their value from high gross margins (consistently topping 80%), long-term customer lock-in via complex on-premise or cloud deployments, and linear, predictable revenue decay. A company that scaled to $100M ARR was expected to grow at roughly 30% to 50% year-over-year. Burn multiples hovered around 1.0x to 1.5x during hyper-growth phases, and headcount scaled linearly with top-line expansion, routinely yielding between $200K and $250K in revenue per full-time employee (FTE).
The Structural Shift (2023–2024)
As generative AI models matured, foundational workflow software underwent a fundamental paradigm shift. Usage-based pricing models, rapid product cycles, and heavy compute/infrastructure overhead began to distort traditional financial statements. Early-stage AI startups experienced explosive initial demand, but their unit economics looked radically different from traditional SaaS: compute costs depressed initial gross margins, and lower switching barriers threatened gross revenue retention.
The Pacesetter Era (2024–2026)
With the publication of The Pacesetter Index, ICONIQ has formally codified the financial profile of the AI-native enterprise. By analyzing quarterly operating data through mid-2026, the index proves that the top tier of software companies is no longer bound by historical decay curves. Instead, these entities are accelerating at scale, defying historical norms by bending revenue growth curves upward, utilizing fewer employees, and absorbing heavy infrastructure costs in exchange for hyper-expansion.
Supporting Context & Metrics: Eight Defining Findings
A granular examination of the eight primary findings within the Pacesetter Index reveals how fundamentally operating metrics have transformed.
1. 115% Growth Is the Median at $100M+ ARR
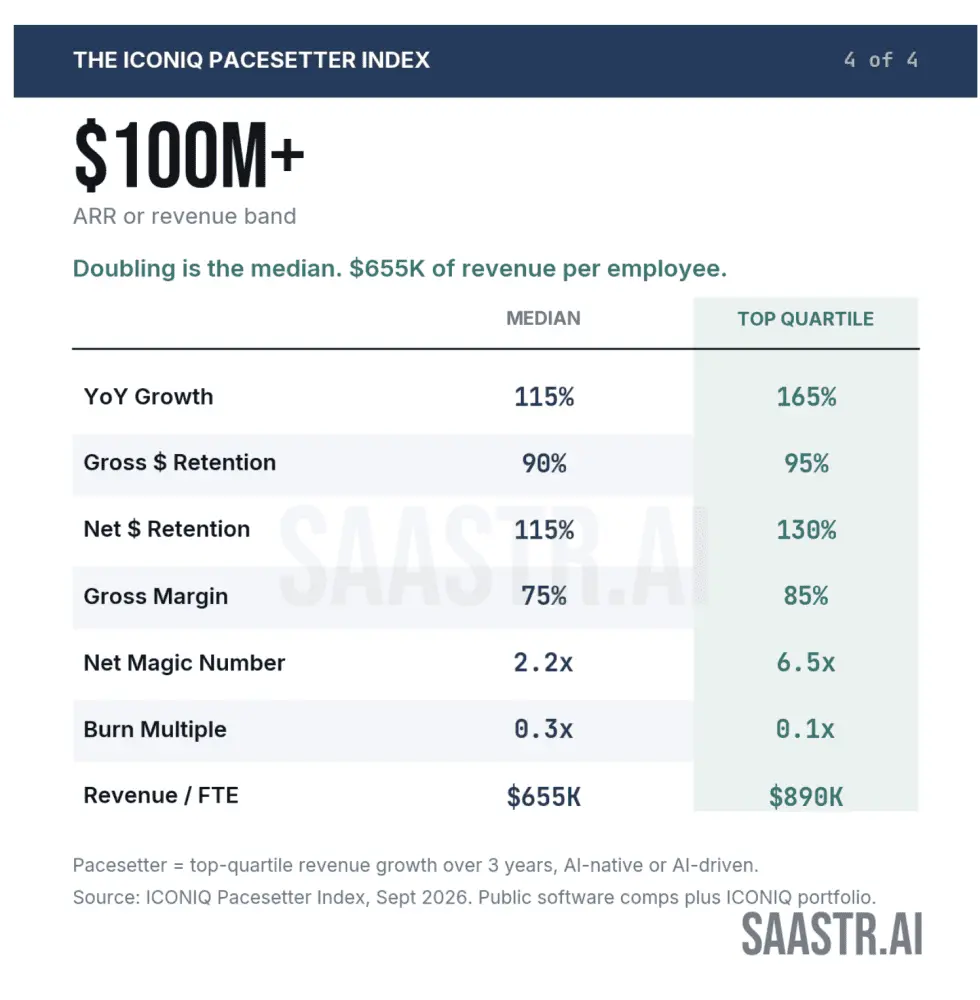
Historically, a company crossing the $100M ARR threshold while growing at triple-digit rates was a once-in-a-decade unicorn. Within the Pacesetter cohort, 115% year-over-year growth is the median, with the top quartile reaching an astonishing 165%.
Furthermore, these companies are defying traditional growth decay models. Instead of experiencing predictable deceleration, AI-native organizations frequently accelerate as they mature due to rapid consumption loops and immediate cross-product expansion.

2. 900% Growth Is the Median Under $10M ARR
At the earliest stages of scale, the numbers defy traditional early-stage heuristics. Companies under $10M ARR boast a median growth rate of 900%, with top-quartile performers touching 2,600%. While smaller baseline numbers amplify percentages, this distribution signals that early product-market fit in the AI era is compounding at nearly 10x per year, setting an impossibly high bar for seed and Series A fundraising rounds.
3. Gross Margins Start at 55%, Not 80%
The traditional rule dictating that anything below a 75%–80% gross margin constitutes a services business rather than software is officially dead.
- Under $10M ARR: Median gross margins sit at 55%.
- $10M–$25M ARR: Median gross margins rise modestly to 60%.
- $25M–$100M ARR: Margins recover sharply, approaching traditional software standards (75%–80%) as inference costs are optimized, contracts are repriced, and workloads shift toward high-value deployments.
4. Gross Retention Falls to 90% at $100M+
While net revenue retention (NRR) often captures the limelight, gross dollar retention (GDR) has re-emerged as a critical metric. At $100M+, the median GDR drops to 90%. This means elite companies lose a tenth of their revenue base annually to churn. The culprit? Lower switching costs, faster sales cycles, and automated proof-of-concept (POC) rollouts that make it just as easy for a customer to leave a vendor as it was to sign up in the first place.
5. Net Revenue Retention Peaks Between $25M and $100M
The trajectory of Net Revenue Retention (NDR) follows a distinct curve across stages: 105% (under $10M) $rightarrow$ 125% ($10M–$25M) $rightarrow$ 130% ($25M–$100M) $rightarrow$ 115% ($100M+).
- Pre-$10M NDR sits at a modest 105% because early customers are largely running experimental pilots, many of which fail before expansion motions are fully operational.
- NDR peaks mid-lifecycle at 130% before experiencing compression at scale due to the law of large numbers and underlying gross retention leaks.
6. Burn Multiples Peak at 1.8x in the $10M–$25M Band
Capital efficiency is non-linear for Pacesetters. The burn multiple sequence runs 1.3x (under $10M) $rightarrow$ 1.8x ($10M–$25M) $rightarrow$ 0.9x ($25M–$100M) $rightarrow$ 0.3x ($100M+).
The $10M–$25M bracket is exceptionally capital-intensive. Founders here are aggressively scaling Go-To-Market (GTM) motions and absorbing heavy AI compute costs simultaneously, before either achieves peak operating leverage. Beyond $25M, capital efficiency recovers dramatically, dropping to 0.3x for mature Pacesetters.
7. $655K in Revenue Per Employee at Scale
Perhaps the most striking indicator of AI-era operating leverage is revenue per FTE. While historical benchmarks hovered around $200K–$250K per employee, the median Pacesetter at $100M+ generates $655K per employee, with top-quartile performers reaching $890K.
To put this in perspective: a $200M ARR company operating at Pacesetter efficiency employs roughly 305 people, compared to 800 employees under legacy benchmarks. This operational divergence is the direct result of integrating AI agents and automated workflows into the corporate structure.
8. Examining the 3.4x Net Magic Number
Early-stage net magic numbers reach a median of 3.4x, with top-quartile outliers hitting 7.7x in the smallest cohort. While historically celebrated, ICONIQ cautions that an excessively high magic number at early stages often masks underinvestment in GTM teams, signaling that founders may be leaving long-term market capture on the table by delaying full sales expansion.
Official Perspectives and Analytical Context
Industry analysts and institutional investors emphasize that interpreting the Pacesetter Index requires strict contextual awareness. Because the index measures a curated basket of top-tier AI-native and hyper-growth venture portfolios alongside public tech leaders, it represents an aspirational frontier rather than a market-wide median.
As experts note, failing to hit Pacesetter metrics does not signify failure. However, because private market valuations and late-stage financing rounds are increasingly priced against these exact parameters, understanding the underlying mechanics—such as the transition from low initial gross margins to long-term recovery—is vital for strategic corporate planning.
Future Outlook: Actionable Takeaways for Your 2027 Plan
Founders and executives preparing their forward-looking operational strategies must integrate these structural shifts into their financial models and board reporting:
- Incorporate Dated Gross Margin Recoveries: Accept that 55%–60% gross margins are acceptable at early stages, but explicitly model the quarter in which margins cross 75%, backed by concrete optimization and repricing drivers.
- Elevate Gross Retention Reporting: Track Gross Dollar Retention (GDR) alongside Net Revenue Retention (NDR) in every board meeting. Relying solely on NDR can obscure structural leakage in the customer base until it becomes terminal.
- Model NDR Decay at Scale: Avoid holding NDR flat indefinitely. Account for natural expansion peaks between $25M and $100M ARR and subsequent compression in later stages.
- Engineer Headcount Backwards from Revenue-per-Employee Targets: Establish a firm target for revenue per FTE at $100M ARR (such as the $655K Pacesetter median) and enforce strict hiring discipline against that metric to secure optimal capital efficiency.
By viewing these benchmarks through the lens of outlier performance rather than universal mandate, modern tech leaders can successfully navigate the complexities of the AI era and build resilient, highly leveraged enterprises.