

Executive Overview
Navigating the bustling streets of Chittagong—Bangladesh’s primary commercial port and its second-largest metropolis—has long been a formidable challenge for residents, commuters, and urban planners alike. Characterized by winding hillside topographies, heavily bottlenecked freight corridors surrounding the port, and rapidly sprawling suburban frontiers, the city presents a complex transportation puzzle. In this environment, physical distance on a standard two-dimensional map is a notoriously poor proxy for actual travel time. Two locations separated by a mere five kilometers can represent vastly different transit realities depending on the hour of the day, structural bottlenecks, and infrastructural strain.
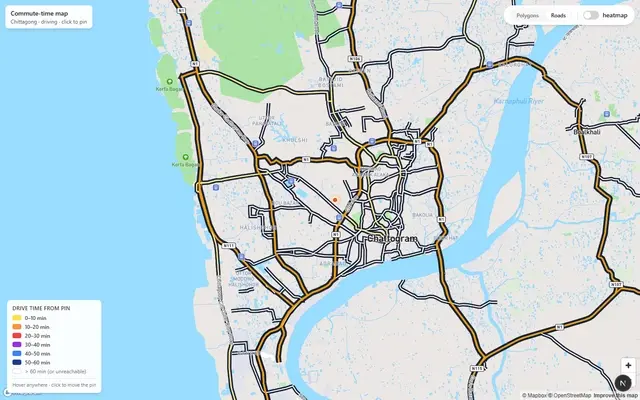
To address this modern urban friction, a software engineer has developed and deployed an interactive, browser-based commute mapping tool tailored specifically to the geographical and infrastructural realities of Chittagong. Available publicly at maps01.shovon.bd, the application offers users a dynamic, single-glance visualization of accessibility: users can click anywhere within the city limits to instantly render a multi-tiered isochrone map illustrating precise driving reachability across 10-, 20-, 30-, 40-, 50-, and 60-minute thresholds.
Built using a modern web-development and geospatial tech stack—anchored by Next.js 15, Mapbox GL JS v3, Turf.js v7, and TypeScript—the project eliminates the friction of traditional destination-based routing tools. Instead of asking drivers where they want to go, this client-side architecture reveals the entire perimeter of where they can escape from any given point. By blending polygon heatmaps with a road-coloring mode and hardware-accelerated style expressions, the project provides a masterclass in modern, zero-backend geospatial web engineering.

Detailed Chronology and Technical Architecture
The development of the Chittagong commute-time map followed a methodical, engineering-first roadmap. Rather than relying on heavy server-side infrastructure or complex containerized microservices, the creator opted for a lean, client-centric architecture capable of static deployment on modern hosting edges like Vercel and Netlify.
Step 1: Establishing the Spatial Canvas
The foundational layer of the application required wrapping Mapbox GL JS within a React component lifecycle using React refs. To ensure optimal performance and prevent navigational confusion, the map’s viewport constraints were strictly bound to Chittagong’s geographical coordinates. By defining custom minZoom, maxZoom, and maxBounds parameters centered over the critical GEC Circle ([91.8123, 22.3475]), the developer effectively prevented users from accidentally panning toward unrelated geographies like Dhaka, keeping all subsequent API queries tightly coupled with local map tiles.
Step 2: Querying the Mapbox Isochrone API
At the heart of the application lies the Mapbox Isochrone API, which calculates polygonal geometries based on geographic coordinates and time thresholds. Because the public API restricts requests to a maximum of four contour values per call, the developer engineered a parallelized fetch mechanism using Promise.all().

// lib/isochrone.ts excerpt illustrating parallel batch fetching
export async function fetchIsochrones(lng, lat, token)
  const [a, b] = await Promise.all([
    fetchBatch(lng, lat, [10, 20, 30, 40], token),
    fetchBatch(lng, lat, [50, 60], token),
  ]);
  const features = [...a.features, ...b.features]
    .sort((x, y) => (y.properties.contour ?? 0) - (x.properties.contour ?? 0));
  return  type: "FeatureCollection", features ;
To optimize performance and minimize unnecessary network payloads, an in-memory caching system was implemented, keyed to latitude and longitude coordinates rounded to four decimal places (roughly 11 meters of spatial precision). Minor cursor shifts reuse previous API payloads, while movements exceeding 15 meters trigger a fresh network request.
Step 3: Designing the Thermal Color Ramp
Visual communication of time required an intuitive psychological gradient. The developer deployed a warm-to-cool palette mirroring thermal imagery: bright yellow (#fde047) designates the immediate 10-minute zone, transitioning through orange, red, and purple, down to deep navy (#1e3a8a) for the outer 60-minute boundary. By leveraging Mapbox style expressions executed directly on the user’s GPU, color interpolation occurs continuously, ensuring smooth visual blending across adjacent time bands rather than harsh, abrupt borders.
Step 4 & 5: Road-Coloring and Heatmap Toggle Functionality
While filled polygon heatmaps offer an excellent macro-level overview, they inherently obscure the underlying street grid. To counter this, the developer introduced a secondary operational mode where individual road segments are dynamically painted according to travel time. Utilizing Mapbox’s spatial within filter expressions, each street segment is evaluated against the isochrone polygons, inheriting the color of the smallest time band that encapsulates it. Furthermore, a toggle mechanism allows users to instantaneously show or hide the GeoJSON fill layers, granting immediate access to the underlying cartography for orientation purposes.

Step 6 & 7: Real-Time Hover Tooltips and Interactive Repinning
Interactivity elevates the tool from a static graphic to an exploratory utility. By integrating Turf.js—specifically its high-performance booleanPointInPolygon library function—the application evaluates the cursor’s exact coordinates against the loaded GeoJSON features in microseconds. Simultaneously, Mapbox’s queryRenderedFeatures method scans for any underlying road layers, extracting street names and displaying a comprehensive hover card detailing the road name and precise travel duration from the active pin.
// Real-time hover detection using Turf.js and Mapbox
const updateHover = (e: mapboxgl.MapMouseEvent) =>
  const pt = turfPoint([e.lngLat.lng, e.lngLat.lat]);
  let best = Infinity;
  for (const f of fc.features)
    const c = f.properties?.contour ?? Infinity;
    if (c >= best) continue;
    if (booleanPointInPolygon(pt, f)) best = c;

  const hits = map.queryRenderedFeatures(e.point,  layers: roadLayers );
  const roadName = hits.find(h => h.properties?.name)?.properties?.name;
  const label = best === Infinity
    ? "more than 60 min away by car"
    : `≈ $best min from pin`;
  hoverPopup
    .setLngLat(e.lngLat)
    .setHTML(`<div>$roadName ? `<b>$roadName</b><br/>` : ""$label</div>`)
    .addTo(map);
;
Supporting Context and Engineering Metrics
Building a client-side geospatial application of this caliber involved navigating several technical bottlenecks and architectural constraints:
- Zero-Backend Cost Efficiency: By eschewing a custom Node.js backend proxy in favor of direct client-to-API communication, the application incurs zero server overhead. Security is maintained via Mapbox’s URL-restricted public tokens (
pk.prefixes), allowing static edge deployment with minimal operational expenditure. - Optimized Rendering Order: A critical rendering challenge involved source-order painting. Because a 60-minute isochrone polygon completely encompasses the 10-minute polygon, rendering features in ascending order would cause the large outer polygon to obscure inner zones. Sorting the feature collection largest-to-smallest ensures that smaller, highly accessible zones always paint on top.
- Enhanced Road Hierarchy Styling: Standard Mapbox street styles frequently wash out underneath semi-transparent heatmaps. The developer successfully resolved this by assigning custom amber palettes (
#f59e0b,#fbbf24,#fde68a) to motorways, trunk routes, and primary roads, paired with near-black casings (#0f172a) to maximize visual contrast against the color-graded fills.
Official Perspectives and Technical Reflections
Reflecting on the development process, the creator emphasizes that the primary hurdles were rooted in user experience design rather than raw data processing. Balancing map legibility under dense thermal layers, tuning hover response times to feel instantaneous, and ensuring smooth client-side geometry calculations required meticulous attention to detail.

"This project showed me that geospatial data is surprisingly approachable in the browser," the developer notes. "Mapbox GL’s GPU-accelerated rendering, its Isochrone API, and Turf.js for point-in-polygon queries gave me a genuinely useful interactive map in a few hundred lines of TypeScript."
Local commuters in Chittagong are encouraged to engage with the tool directly—dropping the interactive marker on residential neighborhoods to visualize the true spatial limitations imposed by urban congestion, traffic bottlenecks, and infrastructural topology.
Future Outlook
As urban centers across South Asia continue to experience rapid, decentralized expansion, data-driven visualization tools are becoming indispensable for urban planning, real estate evaluation, and daily transit optimization.

While the current iteration of the Chittagong commute map focuses exclusively on driving metrics under baseline API conditions, future roadmap considerations include incorporating real-time traffic adjustments, alternative multi-modal transit layers (such as public buses and walking paths), and community-driven feedback mechanisms. By democratizing access to complex geospatial analytics through intuitive web interfaces, projects like this establish a new benchmark for how residents interact with and understand their urban environments.
For those eager to explore the city’s transit boundaries, the live application remains accessible at maps01.shovon.bd, providing an uncompromising, data-backed look at real-world urban mobility in Chittagong.