

By Alberto Onetti, Chairman of Mind the Bridge and Professor at the University of Insubria
At Mind the Bridge, our teams are regularly asked to put hard numbers on something that is, by its very nature, slippery and hard to pin down: the health of a regional innovation ecosystem. Governments, corporate innovation heads, and venture investors all want the same analytical holy grail—a definitive benchmark that reveals precisely how their country, state, or metropolitan area stacks up against the rest of the world.
The core challenge, however, is that no two startup ecosystems look alike. Any comparative methodology rigid enough to allow for seamless cross-country comparisons risks flattening precisely the unique cultural, industrial, and institutional traits that make a place distinctive.
For years, our organization has wrestled with this methodological tension, refining a model that is standardized enough to compare Boston with São Paulo, or Tel Aviv with Turin, yet flexible enough to capture what is genuinely distinct about each.

This week in Seoul, we presented the latest application of that diagnostic work: The Innovation Economy of South Korea. This milestone offers a timely window to lay out our analytical framework, examine how we measure the health of a tech economy, and unpack the deliberate, multi-decade strategy that transformed South Korea into a global innovation titan.
Executive Overview: The Architecture of Innovation
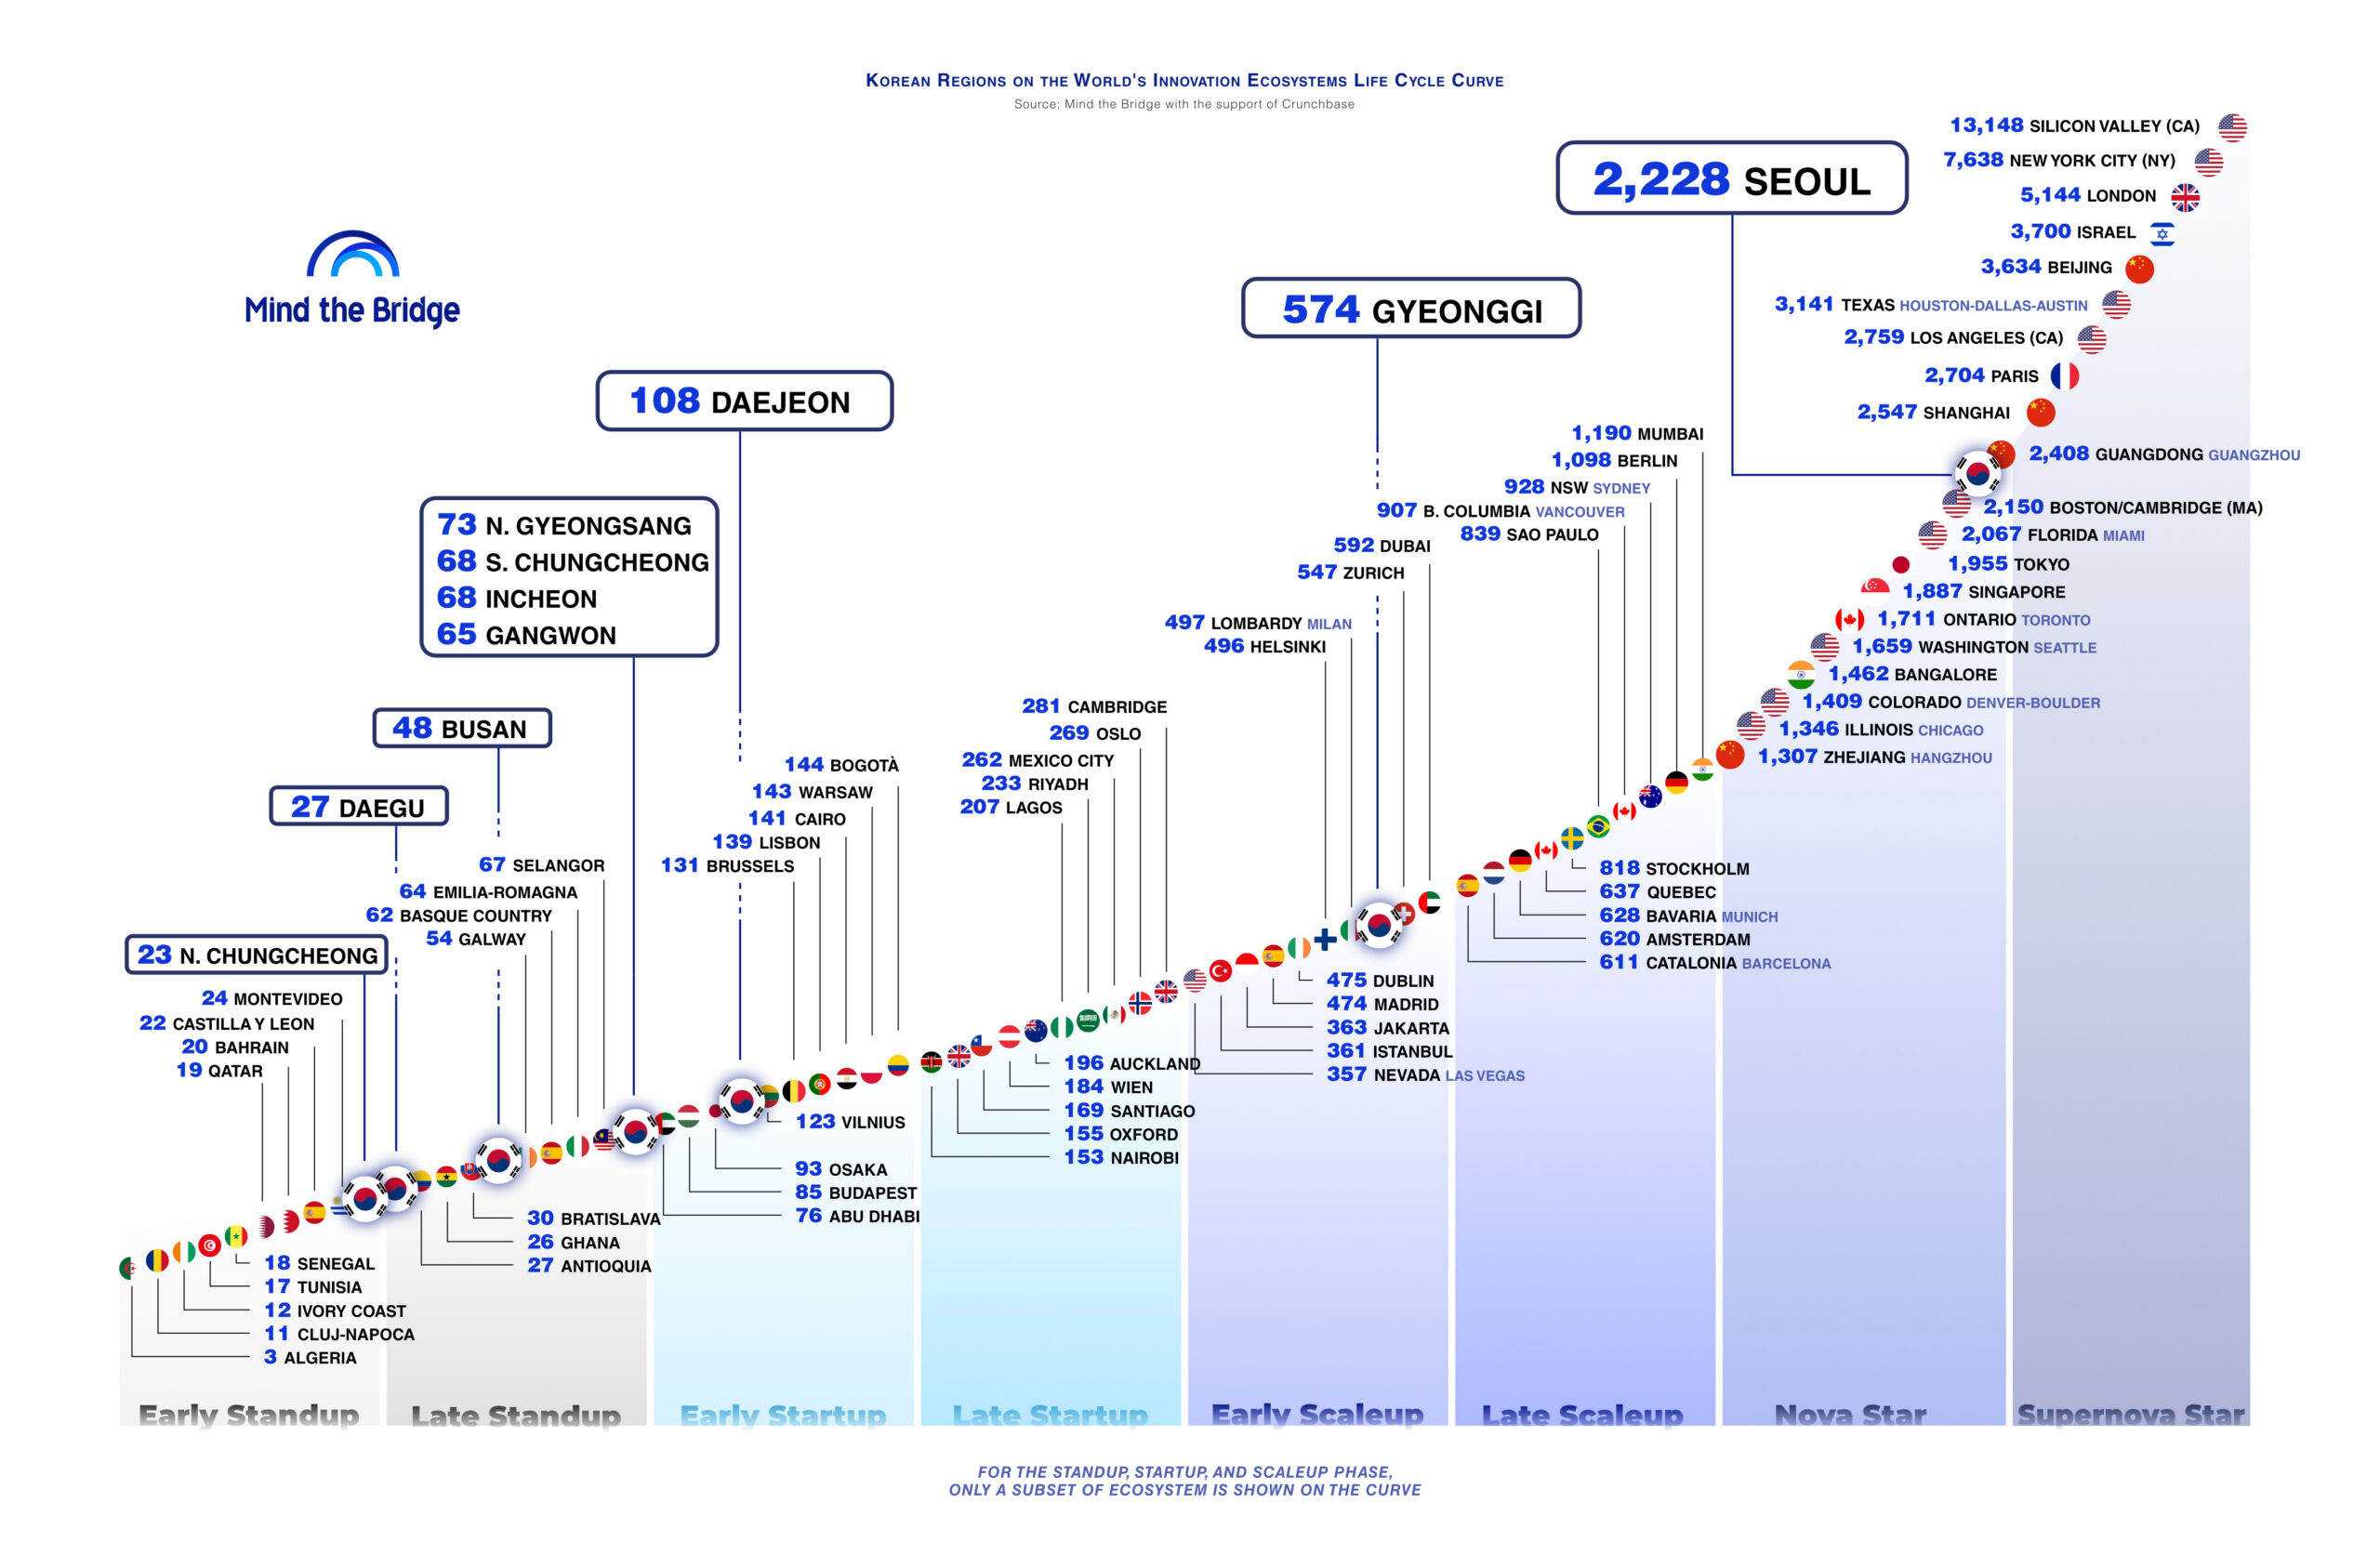
Every modern innovation ecosystem can be visualized as a pyramid. At the wide base sit early-stage startups—venture-backed technology companies still iterating on their core value propositions, building their products, and hunting for product-market fit.
As we move up the pyramid, the base narrows into scaleups: companies that have demonstrated clear market traction by raising more than $1 million in venture capital. Scaleups represent the most structured, highly visible output of an ecosystem. For that reason, they serve as one of the best proxies for an ecosystem’s structural maturity. By tracking their absolute volume, compound growth rate, and sectoral makeup against the Innovation Ecosystems Life Cycle Curve, researchers can derive an accurate read of an economy’s developmental stage.
At the absolute apex of the pyramid sit the outliers that matter disproportionately: scalers and super-scalers. These are enterprises that have decisively broken out of their domestic market constraints to achieve genuine international scale. A handful of these breakout players can do more for a nation’s global innovation profile than thousands of early-stage startups. Consequently, counting them separately—rather than burying them within a bloated, aggregate "startup" statistic—is essential to any serious analytical methodology.

Beyond Venture Capital: The Hidden Supply Chain
Running parallel to this VC-backed tech pyramid is a secondary, frequently under-measured population: innovative small and mid-sized enterprises (SMEs). These are established, revenue-generating companies that compete aggressively on technology and proprietary intellectual property rather than venture funding rounds.
Ignoring innovative SMEs means missing a massive portion of a nation’s actual economic innovation capacity. This is particularly true in ecosystems—such as South Korea—where corporate-led and government-sponsored R&D have historically played just as large a role as traditional venture capital. Many of these entities emerge as bootstrapped outfits. Some remain independent SMEs, while others eventually secure external institutional funding, migrating upward into the startup and scaleup layers.
All of these technology companies ultimately stem from the fundamental knowledge base generated by local universities and public research institutions. Together, these layers constitute the technology supply side of an economic ecosystem.
Detailed Chronology: A Decade of Divergence
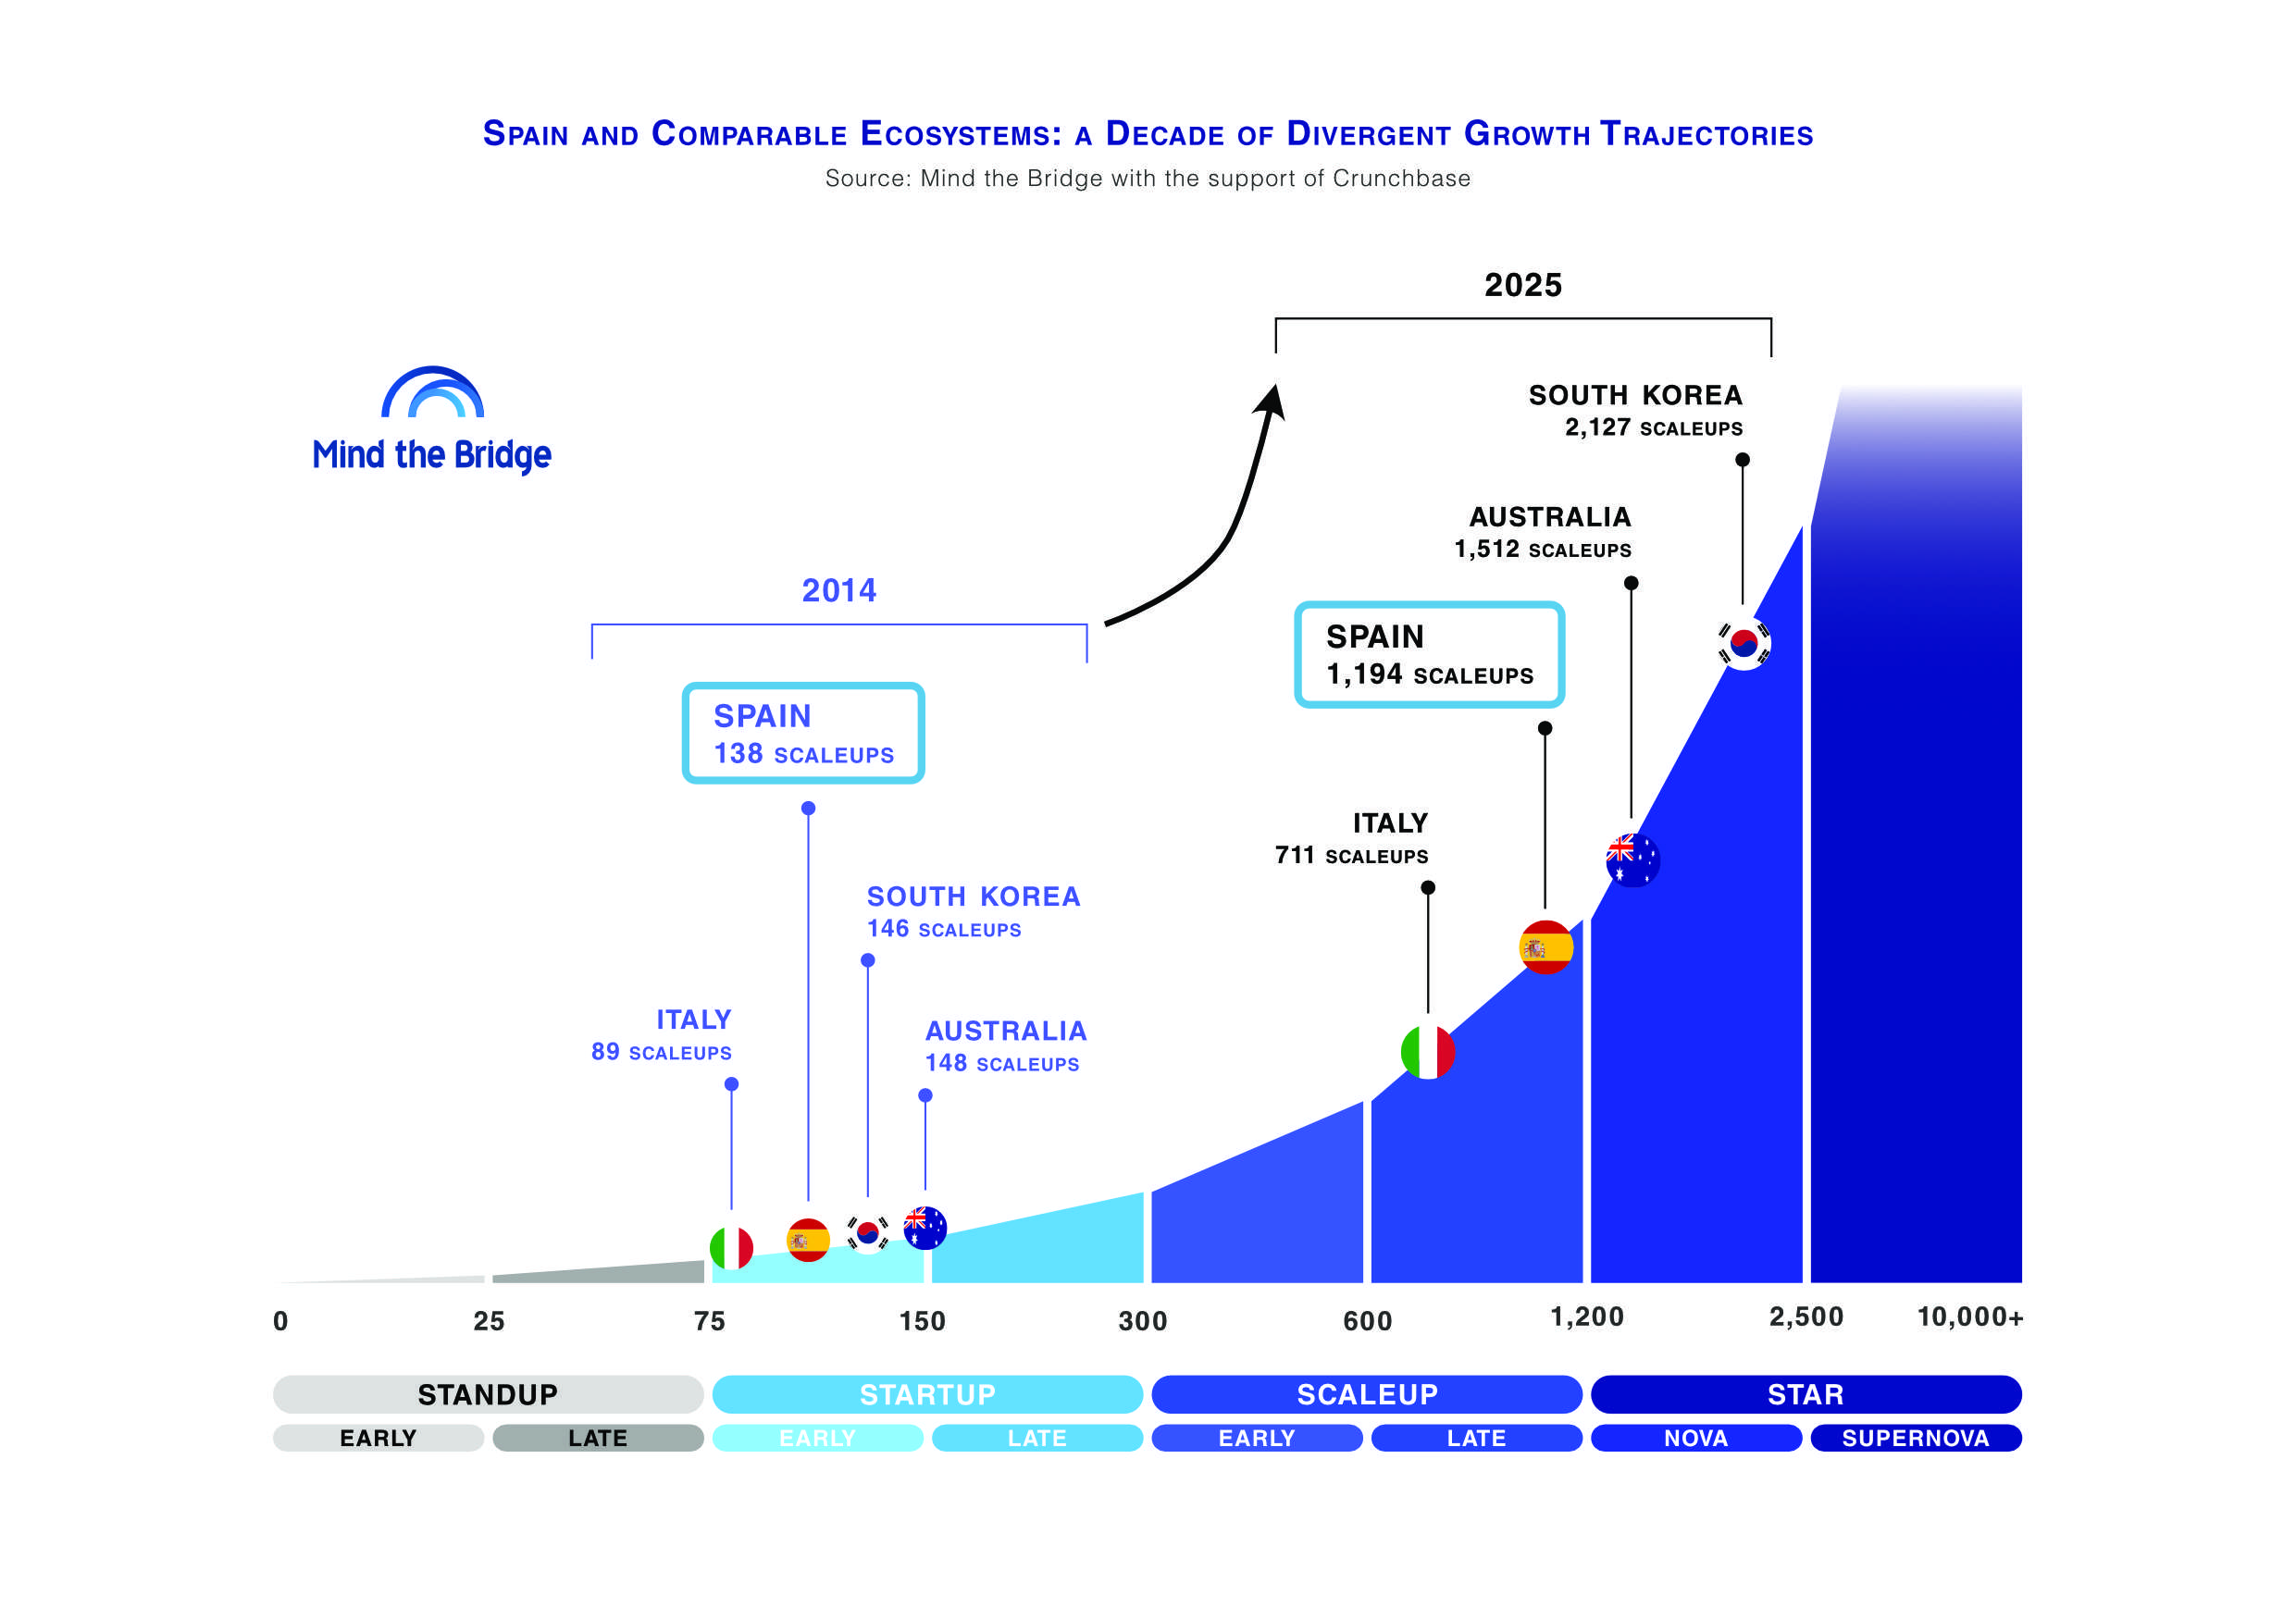
To understand the magnitude of South Korea’s rise, one must look at the historical trajectory over the past decade. Just ten years ago, South Korea’s innovation economy was roughly 40% smaller than those of manufacturing powerhouses like Japan and Germany, roughly comparable in scale to Australia and Spain, and only slightly ahead of Singapore and Italy.
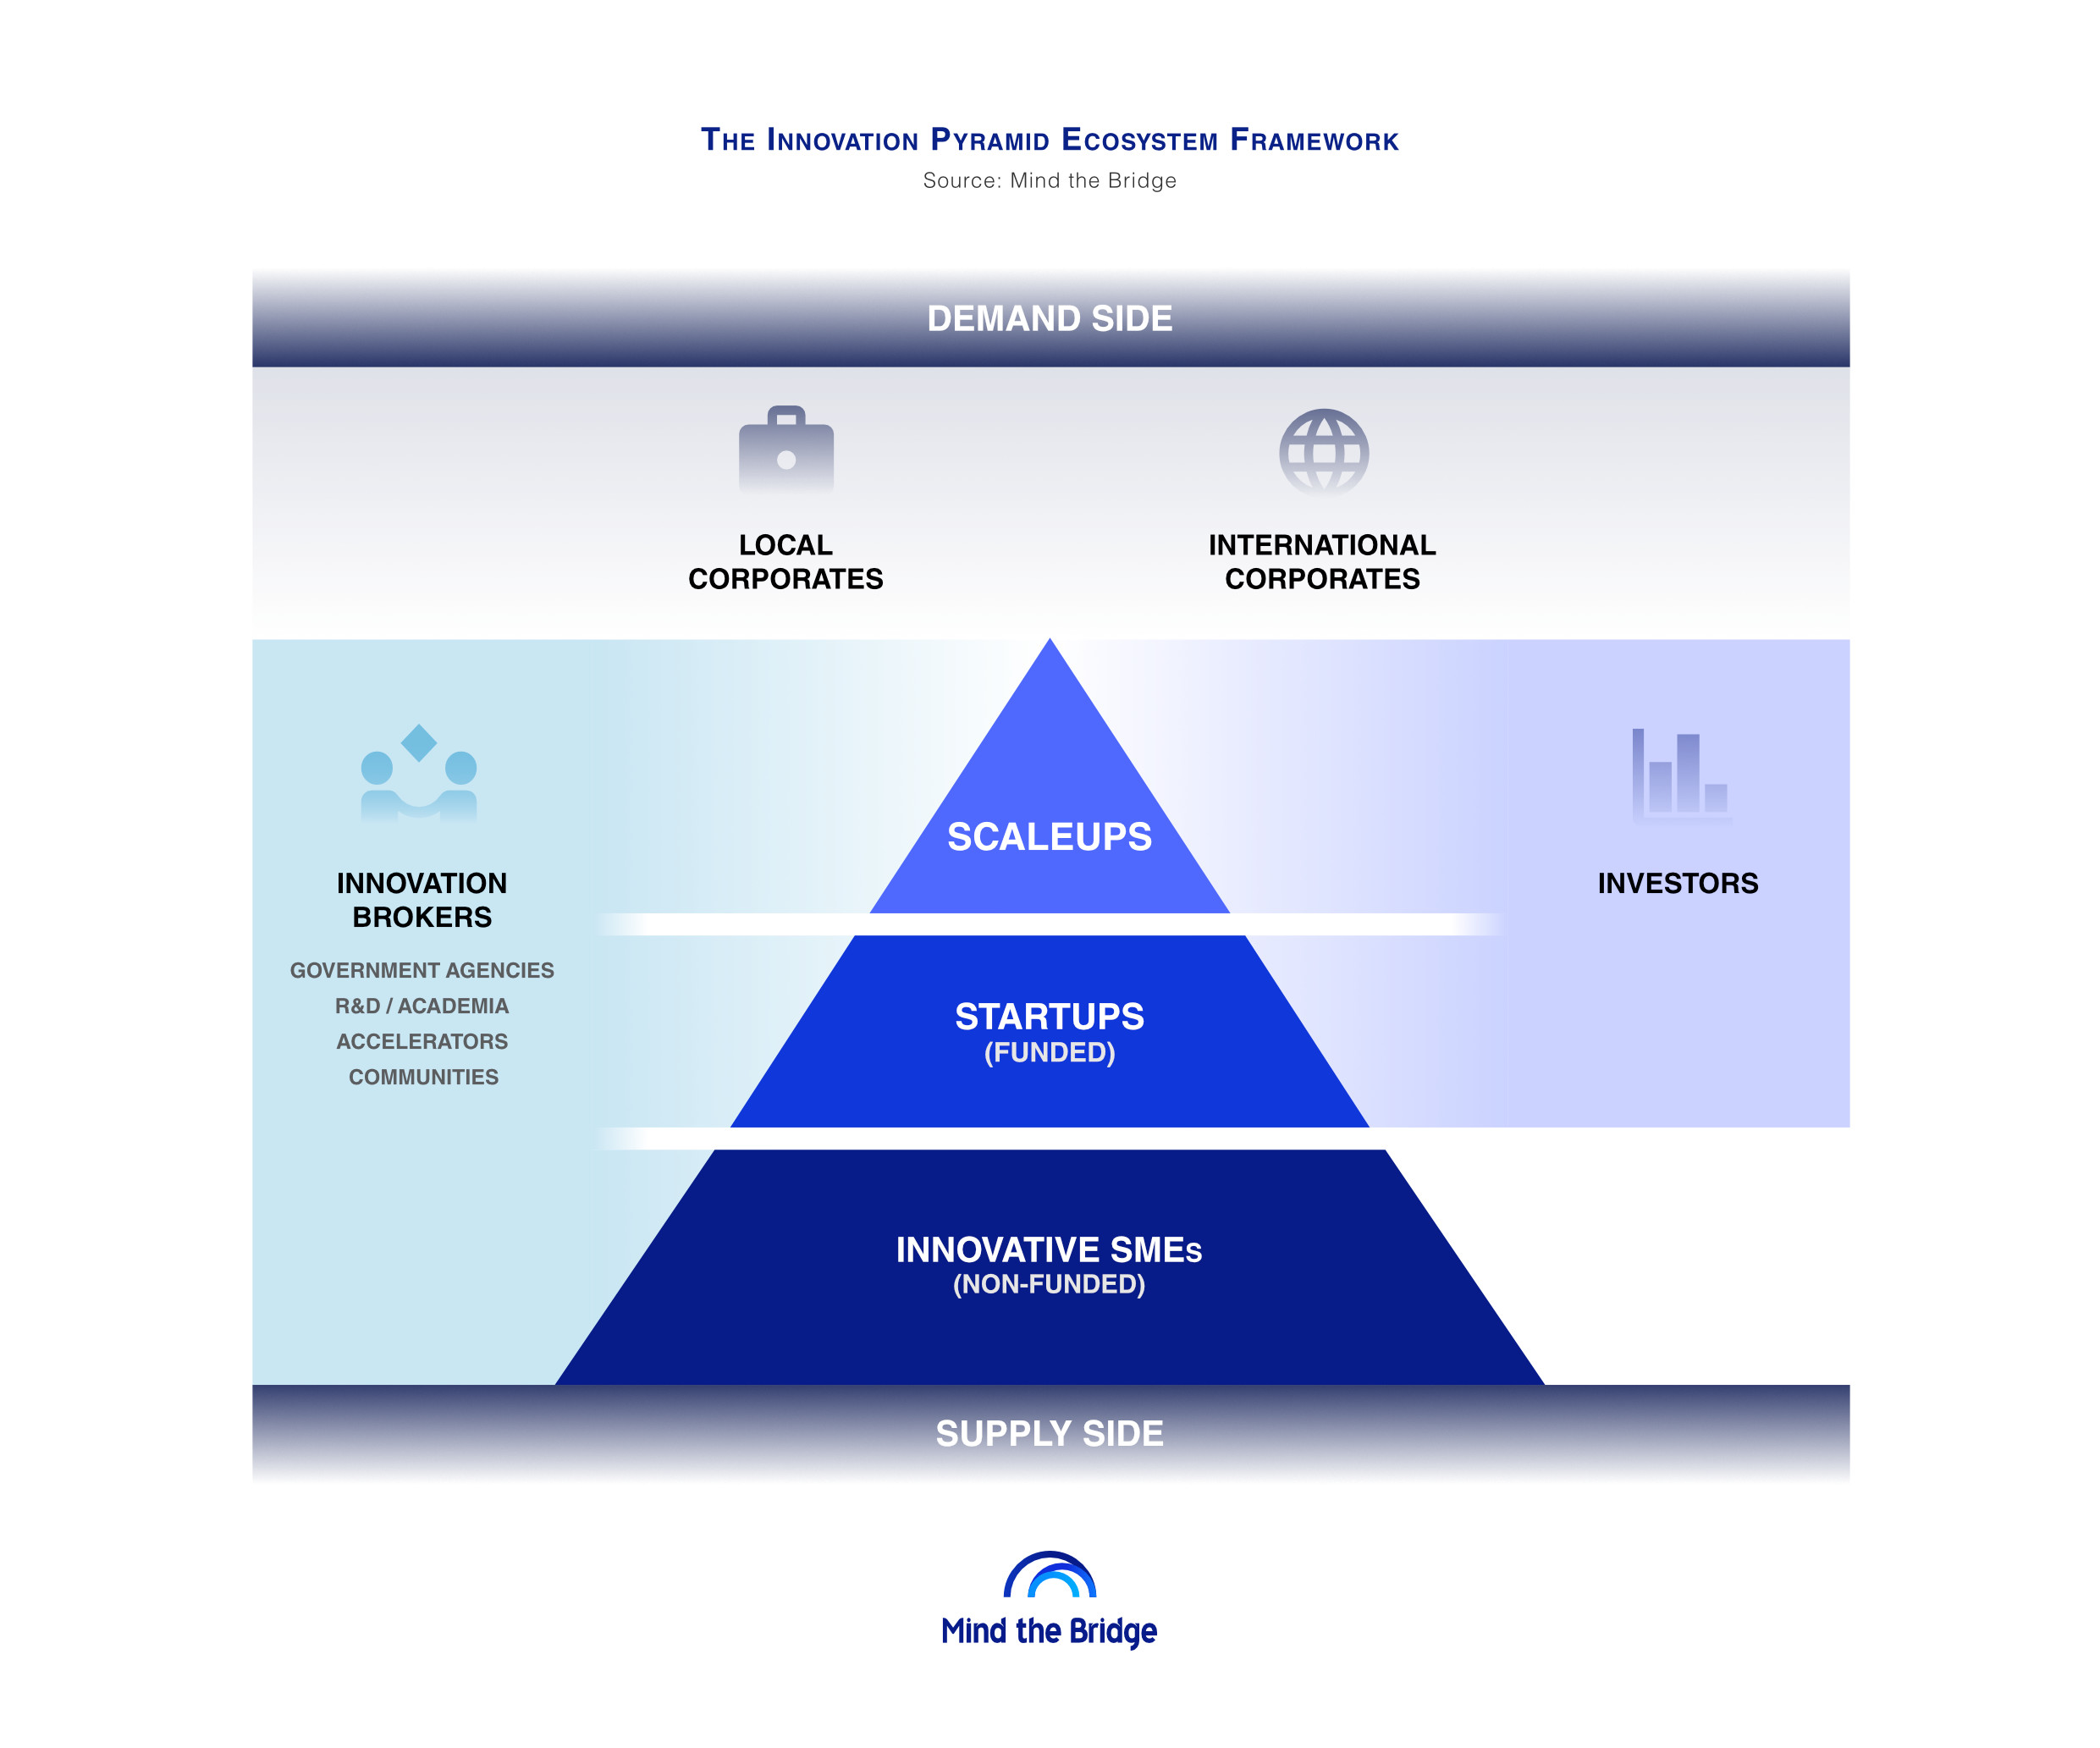
Fast-forward a decade, and South Korea has firmly broken away from the pack. With 3,359 scaleups recorded in the 2025 metrics, South Korea has achieved several historic benchmarks:
- It now stands as the eighth-largest national innovation ecosystem in the world.
- Its capital city, Seoul, ranks as the 11th most developed metropolitan ecosystem globally.
- It has decisively outpaced its historical peer group, leaving economies of similar historical GDP size far behind in scaleup density and velocity.
This extraordinary leap was not a stroke of economic luck. It is the direct result of more than two decades of visionary, forward-looking strategic government direction.
The Evolution of Korean Innovation Policy
- The R&D Foundation (Mid-2000s): The journey began when the Korean government established a foundational framework to drastically accelerate national R&D spending. National investment vaulted from historical levels of 2% to 3% of GDP, establishing a firm baseline floor of 5% by 2008.
- The Entrepreneurial Pivot (2013): Recognizing that heavy industrial manufacturing alone could not secure future economic dominance, South Korea underscored technology entrepreneurship as a core strategic pillar of the national economy. This period marked the launch of TIPS (Tech Incubator Program for Startup), a game-changing initiative designed to supercharge the early-stage funding and incubation segment.
- The Scaleup and Chaebol Integration (2014–2015): Subsequent policies deliberately broadened the framework to support the scaling phase. Between 2014 and 2015, the government established 17 regional Centers for Creative Economy and Innovation (CCEI). This brilliant institutional bridge brought local tech startups into direct contact with South Korea’s massive conglomerates (chaebols), fusing agile startup innovation with corporate industrial scale.
- Regulatory Sandboxes and Deep Tech Focus (2022–Present): Recent years have introduced modern regulatory frameworks that grant tech companies greater freedom to experiment, opened doors to novel financing structures, and incentivized deep-tech venture investments. Since 2022, dedicated instruments have concentrated capital and institutional tools exclusively on hard-science and deep-technology innovation.
Supporting Context & Metrics: The Full Equation
Counting tech companies gives you the supply side of the equation. However, raw technology supply only translates into tangible economic impact when it encounters sustainable market demand.
In modern innovation economies, demand is largely driven by corporate entities—both domestic conglomerates and multinational outposts. Corporates benefit immensely from the bleeding-edge solutions developed by startups and scaleups. Simultaneously, they support startup industrialization and global growth through acceleration programs, venture client models, corporate venture capital (CVC) funds, and mergers and acquisitions (M&A). This symbiotic interaction between technology supply and corporate demand is what converts raw R&D into enterprise growth.
Furthermore, supply must interface with local and global consumer markets. Consumer demand represents the other half of the equation, particularly for B2C companies whose growth paths rely on direct market adoption rather than enterprise sales cycles.
Capital and Public Support
The evolution of any ecosystem is continuously fueled by two distinct streams of capital: private and public.
- Private capital—sourced from angel networks, traditional venture capital firms, and CVCs—provides companies with the financial fuel required to commercialize products and scale operations.
- Public support arrives via subsidies, non-dilutive grants, and government-backed initiatives delivered through innovation agencies and regional brokers.
The stronger the structural connections between these capital sources and the companies sitting within the innovation pyramid, the faster those companies can graduate from early-stage startups to mature scaleups. Unsurprisingly, less advanced ecosystems require heavier initial injections of public capital to bridge structural funding gaps and ignite momentum.
Critical Mass and External Attractiveness
When a regional ecosystem reaches a critical threshold in company volume, talent density, and technological quality—typically crossing into the "Star" stage of the Innovation Ecosystems Life Cycle Curve—it naturally begins to attract intense interest from external players. International investors, multinational corporations, and foreign government agencies establish local outposts because geographic proximity grants them superior access to proprietary deal flow, premier engineering talent, and emerging market partnerships.
Measuring this external attractiveness requires tracking the proliferation of corporate innovation outposts and foreign government innovation hubs. While these external indicators often lag an ecosystem’s foundational progress by two to three years, they serve as powerful confirmation metrics for ecosystem maturity.
Official Statements and Analytical Findings
During the presentation of the Innovation Economy of South Korea report in Seoul, Mind the Bridge researchers detailed the precise composition of the nation’s technological landscape:
- The Scaleup Layer: Exactly 3,359 high-growth scaleups occupy the upper tiers of the pyramid.
- The Startup Base: Directly beneath the scaleup tier sits a robust foundation of approximately 10,000 active early-stage startups.
- The SME Foundation: Broadening the base further are approximately 25,000 non-VC-backed technology companies (innovative SMEs) that drive core segments of the real economy.
- The Supporting Infrastructure: The enabling ecosystem comprises approximately 700 active financial investors and more than 550 innovation brokers (both public and private) powering upwards of 800 distinct entrepreneurial support programs.
While scaleup counts are derived from rigorous, bottom-up analytical data, figures covering SMEs and support programs represent comprehensive macro-assessments synthesized from government databases and consolidated registry sources. By open-sourcing these datasets through the MTB Innovation Ecosystem Platform, Mind the Bridge aims to foster deeper cross-border collaboration and build enduring global innovation bridges.
Future Outlook: Diagnosis Over Scoreboards
Ultimately, mapping an innovation economy is not an academic exercise. The output of this diagnostic methodology is designed to be aggressively actionable. When delivered to policymakers, it shifts the narrative from a superficial vanity scoreboard into a clinical medical diagnosis. It reveals precisely where a national economy sits on the life cycle curve, pinpoints structural bottlenecks, and benchmarks performance against international peer economies striving to complete the arduous transition from a "startup nation" to a "scaleup nation."
South Korea has proven that with long-term strategic vision, sustained R&D commitment, intelligent regulatory frameworks, and deep integration between agile startups and legacy corporate giants, an economy can successfully rewrite its technological destiny. As global markets navigate an increasingly complex technological landscape, Seoul’s playbook offers a masterclass in how to engineer an enduring innovation powerhouse.
To explore the complete dataset and read the full analytical findings, download Mind The Bridge’s comprehensive report, available on the MTB Ecosystem Platform.