

Executive Overview
For decades, the Initial Public Offering (IPO) has been heralded as the holy grail of startup growth—the ultimate Plan A for founders, early investors, and employees whose equity has been locked away in private companies for years. Conventional wisdom teaches that ringing the opening bell at the New York Stock Exchange or NASDAQ marks the finish line of a high-risk, high-reward entrepreneurial journey.
However, a rigorous examination of modern tech market data reveals a starkly different reality. For most cap table participants, the IPO date is not a liquidity date; it is merely the starting gun for a grueling, multi-year trickle of share distributions. While the median tech company now takes 11.5 years to reach an IPO—outlasting the standard 10-year lifespan of a venture capital fund—the actual path to realizing cash is defined by protracted lock-up periods, drip-fed open-market sales, and severe compounding opportunity costs.
When evaluating a lucrative cash acquisition (M&A) versus the rocky, diluted road of public markets, founders and investors must confront a hard mathematical truth: an IPO path typically has to be worth 2x to 3x a strong M&A offer just to break even on risk, time, and dilution.
This article investigates the actual timelines of modern market giants—including Snowflake, Rubrik, Samsara, Figma, and SpaceX—and contrasts them with the lightning-fast liquidity of mega-acquisitions like Google’s $32 billion buyout of Wiz. By breaking down the financial mechanics of secondary markets, insider selling pressures, and hurdle rates, we expose why the traditional venture capital clock ticks much slower than most stakeholders realize.
Detailed Chronology: From First Check to Final Share
To understand the friction of venture liquidity, one must trace the timeline from the moment a venture capital firm writes its first check to the day the last share is finally liquidated. The friction points are systemic, long, and heavily regulated.
The Structural Mismatch: Fund Life vs. Company Age
According to data from PitchBook, the median time to an IPO for a technology company sits at 11.5 years. Meanwhile, the standard institutional venture fund operates on a 10-year term, with provisions for a couple of 1-year extensions. This creates an immediate structural misalignment. Fully 45% of today’s unicorns have already spent nine years or more inside VC portfolios before ever testing public waters.
Furthermore, public market listings are increasingly rare. Out of hundreds of venture-backed exits in recent periods (such as the 649 tracked in H1 2025, which included 472 acquisitions, 150 buyouts, and a mere 27 public listings), only about 4% successfully make it to the public markets.
Even when a company beats the odds and goes public, the lead investor is rarely holding cash. Start the clock at the initial seed or Series A check, and the lead investor in a celebrated IPO is typically 10 to 13 years into the lifecycle and still holding substantial blocks of restricted stock.
Case Studies in Post-IPO Drag
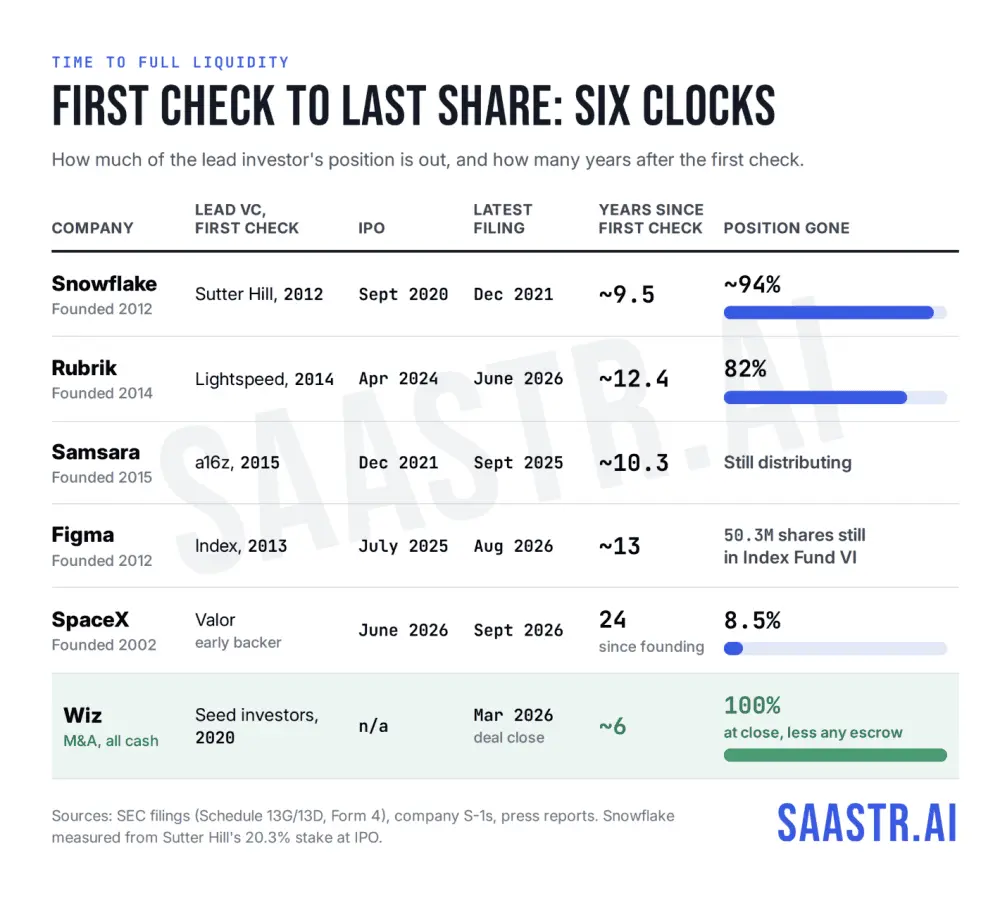
- Snowflake (9.5 Years to Near-Complete Liquidity): Snowflake stands as one of the fastest and cleanest examples of VC liquidity in the modern tech IPO era. Taking 8 years to reach its IPO, it required another 15 months of systematic selling for lead backers to work their holdings down to a nominal 1.3%. Crucially, Snowflake’s stock held up exceptionally well through this entire distribution window, making it a best-case scenario.
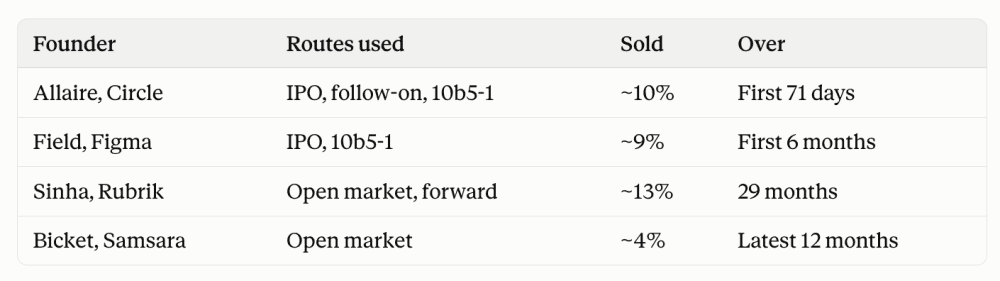
- Rubrik (12.4 Years In, 82% Liquid): Lightspeed Venture Partners reached an 82% liquidation mark roughly 26 months post-IPO—which itself occurred 10.2 years after their initial investment (totaling 12.4 years). At a steady pace of selling roughly 2.4 million shares every six months, extracting the final 18% of their position requires an additional year and a half. Meanwhile, founder Bipul Sinha retained the vast majority of his Class B shares, eventually turning to structured financial instruments like prepaid variable forwards 12.7 years after founding just to unlock a sliver of liquidity.
- Samsara (11 Years In, Slow Drip): Founded in 2015 and going public in December 2021 (a relatively swift 6.5 years), Samsara’s post-IPO distribution timeline has nonetheless dragged. Entities affiliated with Andreessen Horowitz (a16z) were still executing in-kind distributions and open-market sales four years after the IPO. Co-founder John Bicket has consistently trickled out roughly 4% of his massive stake per year, illustrating how long founders remain tethered to their original paper wealth.
- Figma (13 Years In, Massive Residual Holdings): Following a turbulent regulatory saga that saw a blockbuster acquisition by Adobe fall through after 15 months of limbo, Figma pursued the public route. CEO Dylan Field executed minor sales around the IPO and pre-unlock windows, unloading roughly 9% of his total stake for an estimated $190 million. Yet, a year following its public debut, Field still controlled nearly 50.3 million shares—roughly 90% of his original holdings.
- SpaceX (24 Years to IPO, Staggered Release): Founded all the way back in 2002, SpaceX finally priced and began public trading in mid-2026. Eschewing the traditional 180-day cliff, SpaceX implemented a complex, staggered release schedule featuring 15 distinct distribution dates. Early backers like Valor Equity Partners distributed a mere 8.5% of their massive position in their initial filings, with the remainder locked behind long-term release windows stretching deep into 2027.
Supporting Context & Metrics: M&A vs. IPO Mathematics
When founders debate whether to hold out for an IPO or accept an acquisition offer, they are fundamentally comparing two vastly different risk profiles and liquidity schedules.
The Superiority of M&A Speed: The Wiz Case Study
Consider the trajectory of Wiz. Founded in 2020, the cloud security powerhouse agreed to an all-cash $32 billion acquisition by Google in March 2025, which officially closed a year later in March 2026.
While the regulatory approval process was rigorous—spanning 12 months across the US, European Union, Australia, Israel, and other jurisdictions—it represents a blindingly fast path compared to the public market timeline. Founders, seed investors, and early employees all realized life-changing, guaranteed cash on a single day, just six years after company inception.
Even when M&A deals involve friction, it pales in comparison to public lock-ups. According to SRS Acquiom’s market data, standard M&A holdbacks involve a median escrow of roughly 10% (or as low as 2.8% when Representation and Warranty Insurance is utilized). Deals can certainly die—as evidenced by the aborted Adobe-Figma merger, which cost 15 months of executive focus—but when they cross the finish line, the payout is swift and absolute.
The Founder’s Selling Cadence
Public market rules, specifically SEC Rule 144, are frequently blamed for slowing down insider liquidation, but the regulatory caps are actually quite generous. Rule 144 limits an affiliate’s open-market sales to the greater of 1% of the class or the average weekly trading volume over the preceding four weeks. For a company like Figma, that equates to roughly 4.5 million shares per quarter—far higher than what founders typically choose to sell.
Instead of regulatory handcuffs, three primary factors keep founders holding their stock:
- Market Signaling: Massive insider sell-offs can panic public retail investors and depress the stock price.
- Fiduciary Stewardship: Founders want to project long-term confidence in the business.
- Psychological Anchoring: Believing the company’s best growth phases still lie ahead.
Consequently, a founder who sells shares during an IPO and manages to sustain a healthy stock price will typically unload only about 10% of their holdings in the first year, followed by a conservative drip of 3% to 4% annually thereafter.
Official Statements and Institutional Perspectives
Industry leaders and financial analysts have increasingly spoken out against the romanticized view of public listings. Meghan Reynolds of Altimeter Capital highlighted this exact phenomenon using SpaceX as a case study: roughly 40% of private investors’ shares are distributable post-IPO, but Limited Partners (LPs) have received a fraction of that in actual capital return. Public filings consistently back up this assertion, proving that SpaceX is not an outlier, but the institutional norm.
Furthermore, private equity and venture capital firms are adapting their strategies. With secondary transactions becoming a mainstream asset class—exemplified by firms like Stripe executing regular employee tender offers every six months without public filings—the traditional binary choice between "staying private forever" or "rushing to an IPO" is evolving.
However, secondary markets do not completely rewrite the math for the entire cap table. As venture analysts note, selling 20% of a company via a tender offer does nothing to solve the risk profile of the remaining 80%.
Future Outlook: The New Valuation Hurdle
For any entrepreneur or investor weighing a substantial M&A offer against the promise of an independent IPO, a strict financial hurdle analysis must be applied. A cash offer delivers liquidity in 6 to 12 months. An IPO delivers liquid pieces slowly over four years, exposed to the brutal volatility of public markets.
To justify holding out for an IPO, the public market outcome must clear three distinct hurdles:
- Compounding Returns: Cash in hand can be reinvested. If safe market indices yield a 10% return, cash compounds by 1.46x over four years. The IPO path must beat this baseline just to tie.
- Concentrated Risk Premium: Holding a single, locked-up stock with insiders dumping shares into a thin public float carries massive idiosyncratic risk. Factoring in a healthy hurdle rate (20% to 25%), the performance bar jumps to 2.07x – 2.44x.
- Dilution Drag: Throughout the multi-year distribution window, equity ownership continuously erodes due to ongoing operational dilution, secondary adjustments, and follow-on offerings.
The Final Formula
When multiplying compounding opportunity costs, concentrated risk premiums, and structural dilution together, an IPO must be valued at roughly 2x to tie an index-adjusted cash baseline, and 3.2x to properly compensate stakeholders for the extreme risk of public market volatility.
[Cash Offer Timeline (6-12 Months)]
        vs.
[IPO Timeline (4+ Year Staggered Release)]
        =
[IPO Must Yield 2.7x - 3.2x the M&A Offer]
Conclusion
An IPO remains Plan A for a reason—when companies like Snowflake succeed, the long-term wealth creation is unmatched. But founders and institutional investors must stop viewing the IPO date as a liquidity event.
When a robust M&A offer lands on the table, it offers guaranteed, accelerated cash that eliminates years of execution risk, market down-turns, and regulatory limbo. Unless an independent public path can definitively project a valuation 2 to 3 times higher than that buyout offer, taking the bird in hand is often the smartest financial decision a cap table can make.