

Executive Overview
In the current landscape of enterprise software, founders and executives of mature, seat-priced businesses are locked in a high-stakes strategic exercise: how to successfully overhaul their product packaging around artificial intelligence without destabilizing their core business model. For years, companies growing in the high single digits have searched for a clean, public test case to illuminate what actually moves the needle, and in what precise order.
As Box reported its financial results for the second quarter of fiscal year 2027, it offered precisely that: one of the cleanest, most transparent live tests in the public B2B market.
Eighteen months after launching its premium tier, Enterprise Advanced—priced at a 20% to 40% premium over Enterprise Plus—Box now boasts five consecutive quarters of comprehensive data. The verdict? The strategic pivot has delivered a real, if modest, acceleration in growth, lifting the company out of a multi-quarter rut of low single-digit expansion. Yet, in absolute terms, the financial acceleration remains measured.
The structural changes observed in Box’s Q2 FY27 print provide a masterclass in modern SaaS repricing, touching on billings acceleration, net revenue retention (NRR) expansion, capital efficiency, gross margin protection amid heavy AI integration, and the complex trade-offs of aggressive share buybacks. For B2B operators navigating the same treacherous waters, Box’s trajectory offers a definitive blueprint of what to expect, and when.
Detailed Chronology of the Q2 FY27 Performance
To understand the current momentum at Box, one must examine the step-by-step evolution of its financial metrics over the past six quarters. Historically bogged down in the low single digits, Box’s top-line metrics have begun to flex upward following the widespread market penetration of Enterprise Advanced.
The Sequencing of SaaS Repricing: Billings vs. Revenue
The most critical takeaway from Box’s Q2 FY27 performance lies in the divergence between short-term transactional health and recognized GAAP revenue.
During the quarter, Box reported total billings of $309.5 million, representing a robust 17% year-over-year increase (and 16% growth in constant currency). This vastly outperformed the company’s prior guidance of "low double digits" and stands in sharp contrast to the pedestrian 5% billings growth recorded in the preceding quarter.
However, reported GAAP revenue grew by just 9% year-over-year, landing at a steady pace that reflects contracts signed months or even quarters prior during fiscal year 2026. This dynamic illustrates a foundational rule of ratable accounting under aggressive repricing: billings lead revenue by several quarters.
The forward-looking book of business corroborates this acceleration. Remaining performance obligations (RPO) climbed to $1.7 billion, marking a 15% increase as-reported (17% in constant currency). Delving deeper into the RPO structure reveals an even more encouraging sign for long-term contract health:
- Long-term RPO grew by 18% (22% in constant currency).
- Short-term RPO grew by a more modest 11% (14% in constant currency).
This spread demonstrates that customers are not merely accepting the new AI-infused price hikes; they are committing to bigger, longer-term contracts. Box invoices for these larger commitments immediately, generating an immediate surge in billings. The corresponding revenue, however, will be recognized ratably over the next eight to twelve quarters. For founders executing a similar repricing playbook, the sequence of indicators is immutable: billings move first, followed by total RPO, then long-term RPO, and finally, recognized revenue.
Net Revenue Retention and Capital Efficiency
Box’s Net Revenue Retention (NRR) has steadily marched upward over recent reporting cycles, moving from 103% in Q2 of the previous fiscal year, to 105% last quarter, and settling at 106% in Q2 FY27. Concurrently, the company noted that Enterprise Advanced revenue accelerated in constant currency for the fifth consecutive quarter.
This retention expansion was achieved with remarkable capital efficiency. Sales and marketing (S&M) expenses grew by a modest 4.4% to $106.7 million, representing a drop in S&M as a percentage of revenue from 34.8% down to 33.2%. Meanwhile, Research and Development (R&D) investments outpaced sales growth, expanding by 9.3% to $78.4 million, while General & Administrative (G&A) expenses fell by 4.7%.
At a $1.28 billion revenue run rate, a three-point increase in NRR translates to roughly $38 million in annualized revenue that Box did not have to spend acquisition capital to secure. Instead, this expansion was unlocked entirely through pricing and packaging adjustments applied to an existing customer base, all while sales spending grew at approximately half the rate of overall revenue.
While a 106% NRR is a healthy improvement for Box’s historical baseline, it remains modest when compared to consumption-priced high-flyers in adjacent markets—such as Snowflake, which posted an NRR of 126% in its most comparable recent periods. Box’s repricing successfully pulled retention out of the low 100s, but it has hit a natural ceiling imposed by its seat-based architecture.
Supporting Context & Metrics
Beyond the top-line figures, Box’s Q2 FY27 statement provides valuable intelligence regarding gross margins, capital allocation strategies, and foreign exchange impacts in an era defined by artificial intelligence deployments.
AI Economics: Governing Versus Consuming Tokens
One of the most pressing concerns for software investors over the past year has been the destructive impact of AI inference costs on traditional gross margins. Many high-growth software and design platforms have seen their margins erode significantly as they subsidize heavy beta usage of generative AI agents.
- Figma, for example, watched its gross margins fall by approximately five full percentage points year-over-year in Q2 due to AI credit costs and unmonetized inference burn.
- Canva was forced to scale back portions of its growth projections because usage and consumption controls could not keep pace with raw demand.
Box, however, successfully decoupled its infrastructure economics from direct token consumption. Non-GAAP gross margin dipped by a negligible 20 basis points to 81.2% (down from 81.4%), while GAAP gross margin held flat year-over-year at 79.1%.
How did Box insulate itself from the crushing inference costs plaguing its peers? Box does not buy the inference; it sells the governance.
During Q2, Box positioned itself as the trusted, secure content layer that third-party models and enterprise agents read from. The company expanded its ecosystem integrations significantly, acting as a launch partner for:
- Anthropic: Opus 5, Opus 4.8, Sonnet 5, and Fable 5.
- Google: Gemini 3.7 Flash, 3.5 Flash, and 3.5 Flash-Lite.
- OpenAI: GPT-5.6.
- Meta: Muse Spark 1.1.
Additionally, Box shipped Model Context Protocol (MCP) integrations connecting its platform with Claude for Legal, Databricks, Figma’s Design Agent, Harvey, IBM watsonx Orchestrate, Notion Custom Agents, Slackbot, and Grok. In many of these workflows, competitors’ agents actively read and process Box-hosted content, with the underlying token billing landing squarely on the competitor or the end customer.
Crucially, Box bundled its advanced security features—including agent guardrails, prompt injection detection, MCP-scoped permissions, agent classification policies, and comprehensive agent audit trails—strictly behind the Enterprise Advanced paywall. Charging a premium price tier to govern someone else’s autonomous agents incurs virtually zero direct inference cost, allowing Box to protect its world-class gross margins.
The Share Buyback and EPS Dynamics
Box’s bottom-line performance in Q2 featured a notable disconnect between operational income and share count reductions. Non-GAAP earnings per share (EPS) rose 21% to $0.40, up from $0.33 in the prior-year period, easily outpacing the 9% growth in revenue.
This earnings expansion was heavily driven by active capital allocation:
- Non-GAAP net income rose 12% from $49.8 million to $55.7 million.
- Diluted share count dropped 7.5% year-over-year, moving from 151.1 million down to 139.7 million shares.
- During Q2 alone, Box repurchased 2.6 million shares for $66 million, bringing total buybacks for the first half of the fiscal year to $185.7 million, with approximately $378 million remaining in authorized buyback capacity.
Calculations indicate that without the aggressive share reduction, the reported $0.40 EPS would have landed closer to $0.37, meaning share buybacks accounted for roughly 43% of the total EPS growth.
This strategy, however, came with a direct opportunity cost on the balance sheet. Cash, cash equivalents, and short-term investments fell to $445 million, down sharply from $760 million a year prior. Consequently, interest income plummeted 58% from $6.7 million down to $2.8 million—now barely covering interest expenses of $2.4 million. Box essentially traded away roughly $4 million a quarter in pre-tax interest income to permanently retire 11.4 million shares.
Guidance Adjustments and Currency Headwinds
In its forward-looking guidance, Box made a paradoxical adjustment that caught analysts’ attention:
- The Revenue Guide: Raised for FY27 to $1.290 billion (up from $1.28 billion), lifting full-year growth expectations from 9% to 10%.
- The EPS Guide: Trimmed slightly for FY27 to $1.54 (down from $1.56), falling below the Wall Street consensus of $1.58.
Two cents of the EPS reduction stem from foreign exchange fluctuations—specifically involving the Japanese Yen, which accounts for roughly 70% of Box’s international revenue (representing about 35% of total revenue). The remaining two cents of the cut are driven by a higher projected diluted share count (now anticipated at 141 million shares for the full year, up from 139 million previously). Because Box’s stock rallied roughly 36% off its April lows, the higher share price mechanically pulled more convertible instruments and stock options into the diluted share count.
Raising top-line revenue expectations while simultaneously cutting EPS guidance due to a rising share price is a rare combination in enterprise tech, reflecting the complex cross-currents of a recovering equity valuation.
Official Statements and Strategic Insights
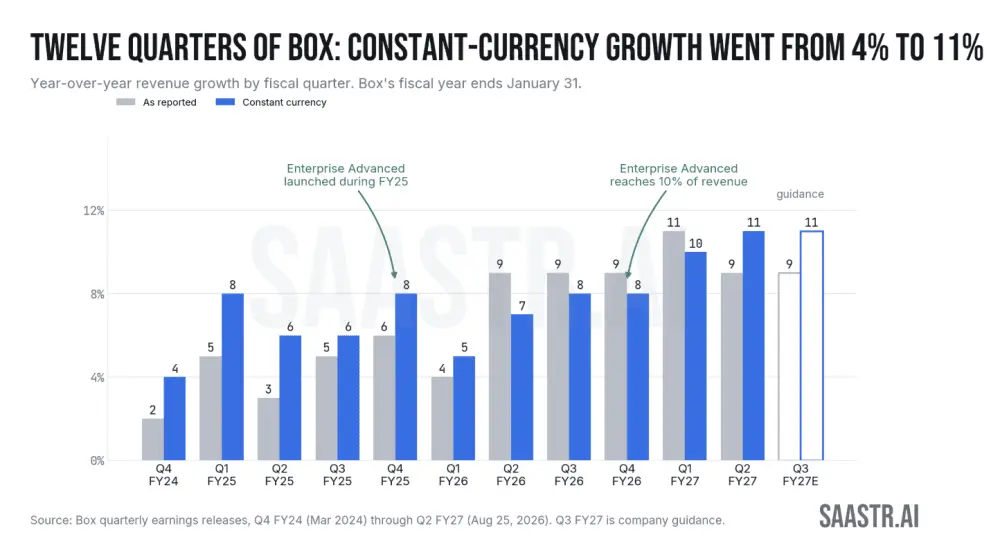
Examining constant-currency metrics reveals the true velocity of Box’s operational turnaround. While reported revenue growth remained steady at 9% (following Q1’s 11% growth and a guided Q3 of 9%), constant-currency performance tells a much more compelling story:
- Q2 FY26 grew 7% in constant currency.
- Q2 FY27 grew 11% in constant currency.
This represents a tangible four-point acceleration over a two-year window, marking Box’s strongest constant-currency growth phase in recent memory. (By comparison, Q2 FY24 grew at just 6% on a reported basis).
Operational efficiency metrics across the board reinforced this steady momentum:
- Operating Cash Flow: Reached $70.8 million, up 54% year-over-year.
- Free Cash Flow: Reached $59.7 million, up 67% year-over-year.
- GAAP Operating Margin: Expanded from 7.0% to 10.2%.
- Non-GAAP Operating Margin: Reached 29.4%.
- Stock-Based Compensation: Dropped as a percentage of revenue from 20.7% down to 19.1% on flat absolute dollars.
Over six quarters of executing the Enterprise Advanced playbook, Box has systematically raised its reported full-year growth rate from 8% in FY26 to a guided 10% for FY27. While a two-point acceleration may seem modest to hyper-growth venture capitalists, at Box’s multi-billion-dollar scale, it represents the difference between stagnation and renewed enterprise relevance.
Future Outlook
For B2B software founders and operators attempting to run the exact same playbook, Box’s journey provides both a validated roadmap and a stark reality check. The sequencing of the metrics is the most valuable takeaway for any executive contemplating a packaging overhaul:
- Billings and Long-Term RPO: These indicators materialize within a single quarter, serving as the immediate canary in the coal mine to signal whether a newly introduced AI tier is resonating with enterprise buyers.
- Gross Margin: This metric responds immediately, revealing instantly whether a company has successfully priced the AI infrastructure costs into its offering or is quietly absorbing unsustainable token burn.
- Net Revenue Retention (NRR): This core metric requires two to three quarters of compounding renewals to visibly shift.
- Reported Revenue: This lagging indicator takes a full year or more to reflect structural changes. By the time the revenue line visibly accelerates, management has already fully committed its roadmap, sales compensation structure, and pricing sheets.
Box successfully defended an 81% gross margin through the teeth of the generative AI buildout because its architecture sidesteps direct token consumption. It monetized the governance, security, and permissions layer that other applications’ agents must pass through, placing the raw computational burden on external API providers. In contrast, application-layer platforms that consume tokens directly have routinely surrendered hundreds of basis points of margin in the exact same window.
Conclusion: The Verdict on Mature SaaS AI Pivots
Box’s Q2 FY27 performance proves that pivoting a mature, seat-priced enterprise software company around artificial intelligence is entirely viable—and that the strategy can yield tangible improvements in billings, NRR, operating leverage, and cash flow generation.
Over six quarters, the implementation of Enterprise Advanced successfully added:
- 3 points of Net Revenue Retention.
- 8 points of billings growth over reported revenue growth.
- 4 points of constant-currency revenue acceleration.
- 320 basis points of GAAP operating margin expansion.
- 67% year-over-year free cash flow growth.
- 2 points of reported full-year top-line growth.
Going AI for real worked for Box. The growth is back, the capital efficiency is undeniable, and the platform has successfully cemented its role as an indispensable content and security layer for the broader agentic AI ecosystem. Yet, as founders look to replicate this success, they must temper their ambitions: at scale, the resulting acceleration is real, but it remains decidedly measured.