

Executive Overview
For decades, the Initial Public Offering (IPO) has been held up as the holy grail of the startup ecosystem—Plan A for founders, venture capitalists, and early employees alike. It represents validation, generational wealth, and public market maturity. Yet, a stark disconnect exists between the celebration of ringing the stock exchange bell and the actual realization of cash.
While market participants treat the IPO date as the ultimate liquidity event, reality tells a radically different story. For the vast majority of the cap table, the IPO is merely the starting gun for a sluggish, multi-year distribution marathon. Lead venture capital investors in stellar public offerings often find themselves holding stock 10 to 13 years after writing their first check.
With the median tech company taking an agonizing 11.5 years to reach an IPO—while a standard venture fund operates on a rigid 10-year lifecycle—the traditional path of going public is colliding with structural market friction. When weighed against swift, multi-billion-dollar cash acquisitions (such as Google’s $32 billion buyout of Wiz), the math reveals an uncomfortable truth: to justify the risk, dilution, and compounding opportunity costs of the public route, an IPO path must realistically command a valuation 2 to 3.2 times higher than a comparable M&A cash offer.
Detailed Chronology: From First Check to Final Distribution
To understand how long capital remains locked up, one must trace the timeline from a company’s inception through its public debut and subsequent share unlocks. The traditional venture clock does not stop at the IPO; it merely shifts into a slower, highly regulated gear.
Snowflake: The Best-Case Modern Scenario
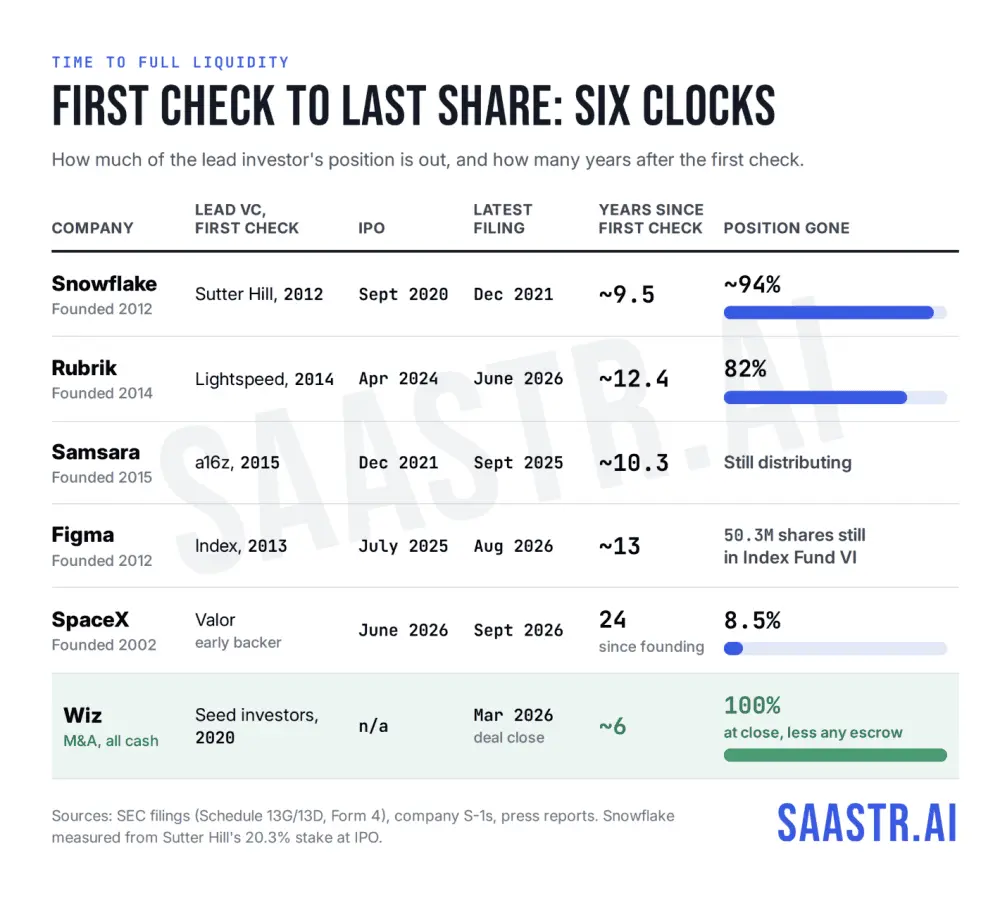
Snowflake stands as one of the fastest and cleanest examples of comprehensive VC liquidity in the modern tech era. Reaching an IPO after roughly 8 years, the company provided a blueprint for swift distribution. However, even in this best-case scenario, it required an additional 15 months post-IPO for lead backers to wind down their positions to 1.3%. Total elapsed time from inception to near-complete liquidity: approximately 9.5 years.
Rubrik: A 12-Year Marathon
For Rubrik, the journey has been significantly more protracted. Lightspeed Venture Partners, a primary backer, sat at 82% out roughly 26 months after the IPO—clocking in at 12.4 years since the first check. At a steady pace of liquidating roughly 2.4 million shares every six months, realizing the final 18% of the position requires an additional year and a half.
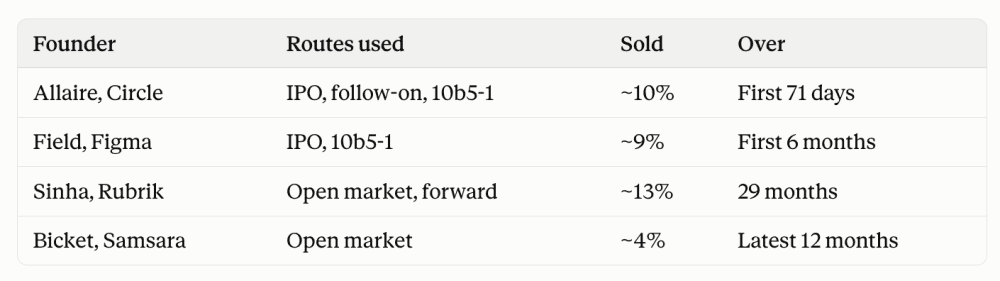
Meanwhile, founder Bipul Sinha maintained a tighter grip on his equity. Holding over 12.3 million shares pre-IPO, Sinha retained roughly 87% of his Class B shares directly years down the line, eventually utilizing structured financial instruments like prepaid variable forwards to unlock liquidity without sacrificing his voting footprint.
Samsara and Figma: The Multi-Year Sell-Down
- Samsara: Founded in 2015 and going public in December 2021, Samsara completed its IPO in a relatively brisk 6.5 years. Yet, distribution filings show entities like Andreessen Horowitz (a16z) executing in-kind distributions and open-market sales nearly a decade after their initial investment. Co-founder John Bicket has steadily shed roughly 4% of his massive stake annually, highlighting the conservative, drip-feed nature of insider selling.
- Figma: Following a heavily publicized aborted acquisition by Adobe, Figma went public, after which CEO Dylan Field retained roughly 90% of his original holdings a full year post-IPO. Despite selling millions of shares across multiple windows, early venture funds still held over 50 million shares, emphasizing that early-stage stakes survive long past the initial trading day.
SpaceX: The 24-Year Ascent
Perhaps the most monumental outlier is SpaceX. Founded in 2002 and pricing its public debut in June 2026, the aerospace giant bypassed the traditional 180-day lock-up cliff in favor of a staggered, multi-tranche release schedule spanning 15 distinct dates. Early backers like Valor Equity Partners have methodically distributed a fraction of their holdings, with the bulk of insider and institutional shares locked deep into multi-year horizons.
Supporting Context & Metrics: The Numbers Behind the Lock-Up
The friction of going public is underpinned by hard data from PitchBook, SRS Acquiom, and regulatory filings. The structural mismatch between corporate maturation and fund lifecycles creates severe pressure points across the venture landscape.
The Structural Time Mismatch
- 11.5 Years: The median time it takes for a technology company to successfully execute an IPO.
- 10 Years: The standard operational term of a traditional venture capital fund. With 45% of current unicorns sitting in portfolios for nine years or more, many funds are forced to distribute illiquid public stock to their Limited Partners (LPs), shifting the burden of timing the market onto institutional investors.
- 4% Public Share: Out of 649 US VC-backed exits recorded in the first half of a recent tracking period, 472 were acquisitions, 150 were buyouts, and a mere 27 were public listings. Just 4% of venture-backed exits successfully make it to the public markets.
The Rise of Secondary Markets and Tender Offers
To bypass the agonizing timelines of traditional IPOs, modern giants like Stripe and Anthropic have leaned heavily into secondary liquidity. Stripe has regularly instituted employee and investor tender offers roughly every six months, granting liquidity windows without demanding a public filing or subjecting stakeholders to traditional lock-up cliffs.
Furthermore, primary IPO composition is shifting. Recent data indicates that insiders and existing cap-table holders are utilizing IPOs to offload significantly more secondary shares than the historical average, reducing the percentage of newly issued capital entering the market.
Official Statements & Industry Analysis
Market observers and venture leaders have increasingly spoken out about the myth of instant IPO liquidity.
Meghan Reynolds of Altimeter famously highlighted this dynamic using SpaceX as a bellwether, pointing out that despite high-profile public valuations, only about 40% of private investor shares are genuinely distributable at any given moment, leaving LPs waiting significantly longer for actual cash returns.
Financial analysts point out that Rule 144 restrictions—often blamed for slowing down insider sales—are actually quite permissive. An affiliate is generally permitted to sell the greater of 1% of the class of stock or the average weekly trading volume every three months. For founders like Figma’s Dylan Field, this translates to millions of shares eligible for quarterly sale.
Therefore, the primary drivers of slow insider selling are not regulatory caps, but rather:
- Signaling Risk: Large-scale insider sales can trigger panic or signal a lack of confidence to public markets.
- Board and Executive Control: Maintaining voting power and structural influence over the company.
- Tax Optimization: Managing capital gains events across strategic fiscal years.
Future Outlook: M&A vs. IPO Mathematical Framework
When founders evaluate whether to accept a multi-billion-dollar cash acquisition (such as Google’s $32 billion cash buyout of Wiz, executed over a 12-month regulatory review period) or push toward an IPO, they must run a rigorous financial model.
Cash in hand arrives within 6 to 12 months. An IPO path pays out in staggered tranches over four years or more. To determine whether the public route is mathematically superior, a founder must account for three critical variables:
- Compounding (The Opportunity Cost of Waiting): Cash received today can be reinvested. Over a four-year window at a conservative 10% index-like return, capital grows by roughly 1.46x. An IPO must outperform this benchmark merely to break even.
- Risk Premium (Single-Stock Volatility): Holding a single, locked-up stock subject to thin trading floats commands a substantial risk hurdle. Applying a 20% to 25% annual hurdle rate elevates the required multiple to 2.07x – 2.44x.
- Dilution: As companies issue secondary shares, grant employee refreshers, and navigate public markets, insider percentages shrink. Factoring in typical post-IPO dilution of 15% to 23% means a company’s total market cap must expand significantly simply for an individual’s percentage slice to retain its absolute value.
The Final Verdict: The 3x Rule
When compounding, risk adjustments, and dilution are multiplied together, an IPO path must realistically target a valuation 2.7 to 3.2 times higher than a definitive M&A cash offer to compensate stakeholders adequately. If secondary tender offers have already allowed founders and early investors to de-risk, that hurdle rate drops closer to 2x.
For founders staring down the barrel of a lucrative acquisition offer versus the grueling, highly uncertain 11.5-year slog to an IPO, the lesson is clear: Plan A is wonderful when it works like Snowflake, but unless an upcoming public debut can clear a massive valuation hurdle over a cash buyout, taking the M&A bird in the hand is often the smartest financial move in tech.