In a major leap forward for enterprise software management, Amazon Web Services (AWS) has officially announced the launch of Amazon CloudWatch Omni. This next-generation, AI-powered observability platform is designed to seamlessly unify the monitoring of traditional cloud applications alongside cutting-edge generative AI and agentic workloads. Built upon the robust foundation of OpenTelemetry, CloudWatch Omni eliminates traditional operational silos by shifting the focus of system monitoring from isolated infrastructure metrics to comprehensive, application-centric perspectives.
For years, engineering teams have battled alert fatigue, manual dashboard maintenance, and fragmented diagnostic tools. During high-pressure incidents, crucial context is frequently lost across disjointed communication channels like Slack threads and static screenshots. CloudWatch Omni tackles these challenges head-on by introducing centralized, collaborative workspaces called "Spaces," integrating enterprise single sign-on (SSO) independent of the AWS Management Console, and deploying the autonomous Amazon DevOps Agent to accelerate root-cause analysis. This article provides an in-depth examination of CloudWatch Omni’s core capabilities, architecture, incident workflows, and its broader implications for modern software engineering.
Detailed Chronology: The Evolution to Application-Centric Observability
The journey toward unified observability has been long and fraught with engineering bottlenecks. To understand the significance of CloudWatch Omni, one must trace the evolution of how development and operations teams monitor complex digital systems.
The Era of Fragmented Monitoring
Historically, engineering organizations relied on separate tools for infrastructure metrics, application performance monitoring (APM), log aggregation, and user experience tracking. While these tools provided deep insights into individual components—such as CPU utilization, database query speeds, or memory leaks—they failed to present a coherent picture of the application as a whole.
When a critical incident occurred, on-call engineers were forced to stitch together disparate data points manually. An SRE might notice a spike in error rates on a dashboard, pivot to a logging tool to search for stack traces, check a separate infrastructure graph for server health, and finally ping a database administrator for query performance metrics. This manual correlation process consumed valuable time, directly impacting Mean Time to Resolution (MTTR) and increasing customer friction.
The Rise of OpenTelemetry and Telemetry Sprawl
As microservices architectures, containerization, and serverless computing grew in popularity, the volume of telemetry data exploded. While the adoption of OpenTelemetry standardized how metrics, logs, and traces were collected and transmitted, it did not solve the operational overhead of managing dashboards and setting static alert thresholds. Teams found themselves spending more time maintaining their observability pipelines and tweaking alert parameters than building features or optimizing application performance.
Furthermore, as enterprises began deploying generative AI models and autonomous AI agents, existing observability frameworks struggled to keep pace. Monitoring probabilistic AI outputs, token usage, agent reasoning loops, and prompt latencies required entirely new paradigms that traditional APM tools simply were not built to handle.
The Introduction of CloudWatch Omni
Recognizing these systemic industry pain points, AWS developed CloudWatch Omni to redefine the observability experience. Announced as a dual-capability release—covering both agentic/generative AI workloads and traditional application observability—Omni represents a paradigm shift.
By leveraging OpenTelemetry natively, Omni ingests telemetry data without requiring cumbersome reconfigurations. Workloads instrumented with OpenTelemetry automatically route their data to an OpenTelemetry Protocol (OTLP) endpoint, while existing CloudWatch customers can access Omni with a single click in the console. By decoupling the observability interface from the core AWS Management Console via enterprise SSO integration (supporting Okta, Microsoft Entra ID, and other SAML 2.0 providers), AWS has made system monitoring accessible not just to specialized SREs, but to developers, database engineers, product managers, and leadership teams alike.
Supporting Context & Metrics: Solving the Modern Engineering Dilemma
To fully appreciate the architectural innovations within CloudWatch Omni, it is essential to examine the core operational challenges engineering organizations face in modern cloud environments.
1. Unified Collaboration Across Team Boundaries
One of the most persistent bottlenecks during a production incident is the "handoff penalty." When an issue crosses team boundaries—such as a checkout service failure ultimately caused by a downstream payment gateway configuration error—context often gets lost.
CloudWatch Omni resolves this by introducing collaborative investigation sessions. Because every authorized team member accesses Omni through a dedicated organizational URL via enterprise SSO (leveraging IAM Identity Center), there is no friction regarding AWS Console permissions or credential sharing. When an incident escalates from a front-end developer to a back-end engineer or a database specialist, the new team member joins the exact same live session. They inherit the complete historical context, active queries, timeline annotations, and AI-driven diagnostic summaries instantly.
2. Adaptive Systems and Dynamic Topology Mapping
Traditional observability tools rely heavily on static dashboards and manually tuned alert thresholds. In fast-moving CI/CD environments where microservices are deployed dozens of times a day, static dashboards quickly become obsolete.
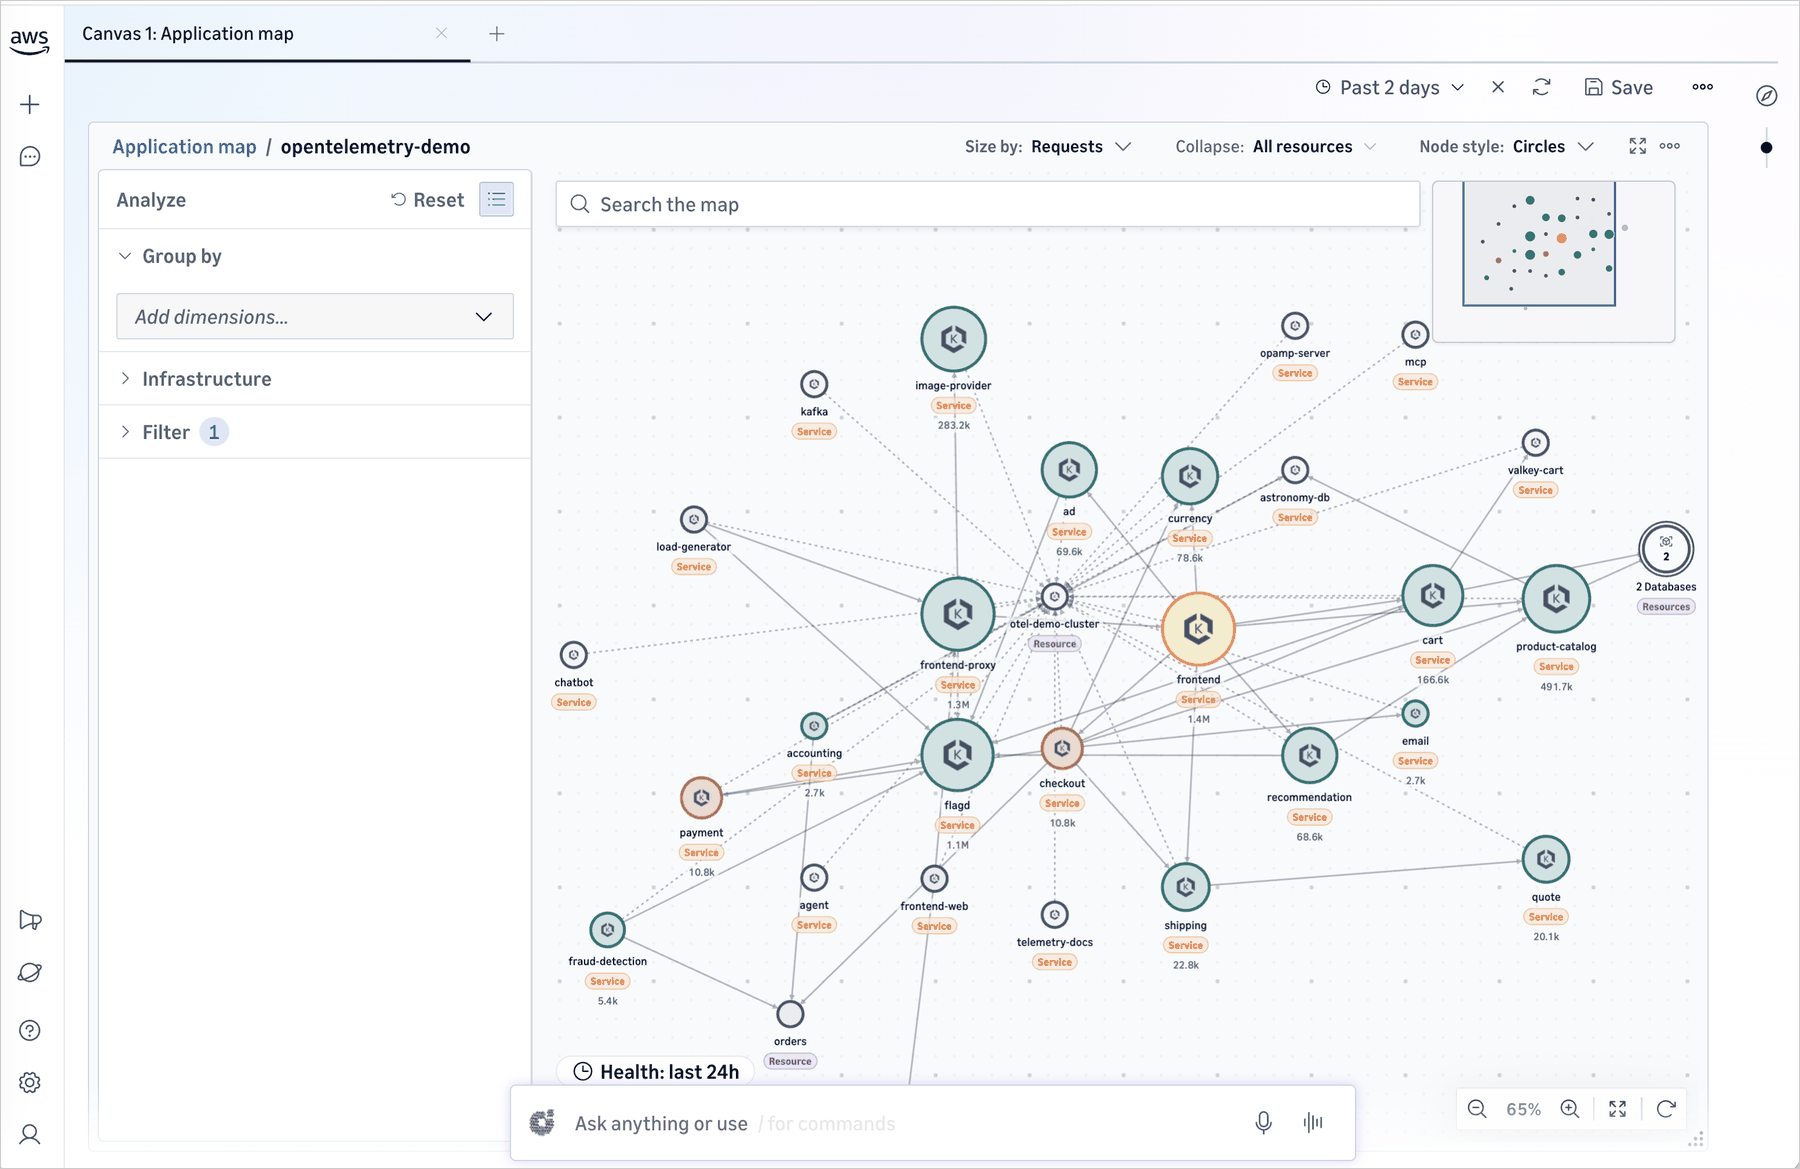
CloudWatch Omni automates the entire discovery and mapping lifecycle. By analyzing incoming telemetry data alongside AWS Config resource discovery, Omni automatically maps dependencies, discovers new services, and updates the application topology in real time. Instead of manually creating dashboards for every new service, engineering teams define high-level targets—such as availability objectives, latency budgets, and error rate tolerances. The system dynamically adapts its monitoring parameters as the underlying application architecture evolves.
3. AI-Powered Investigations with Amazon DevOps Agent
Human cognitive overload is a primary contributor to prolonged incident resolution times. During a complex outage, analyzing thousands of log lines, metric spikes, and trace trees can overwhelm even the most seasoned engineers.
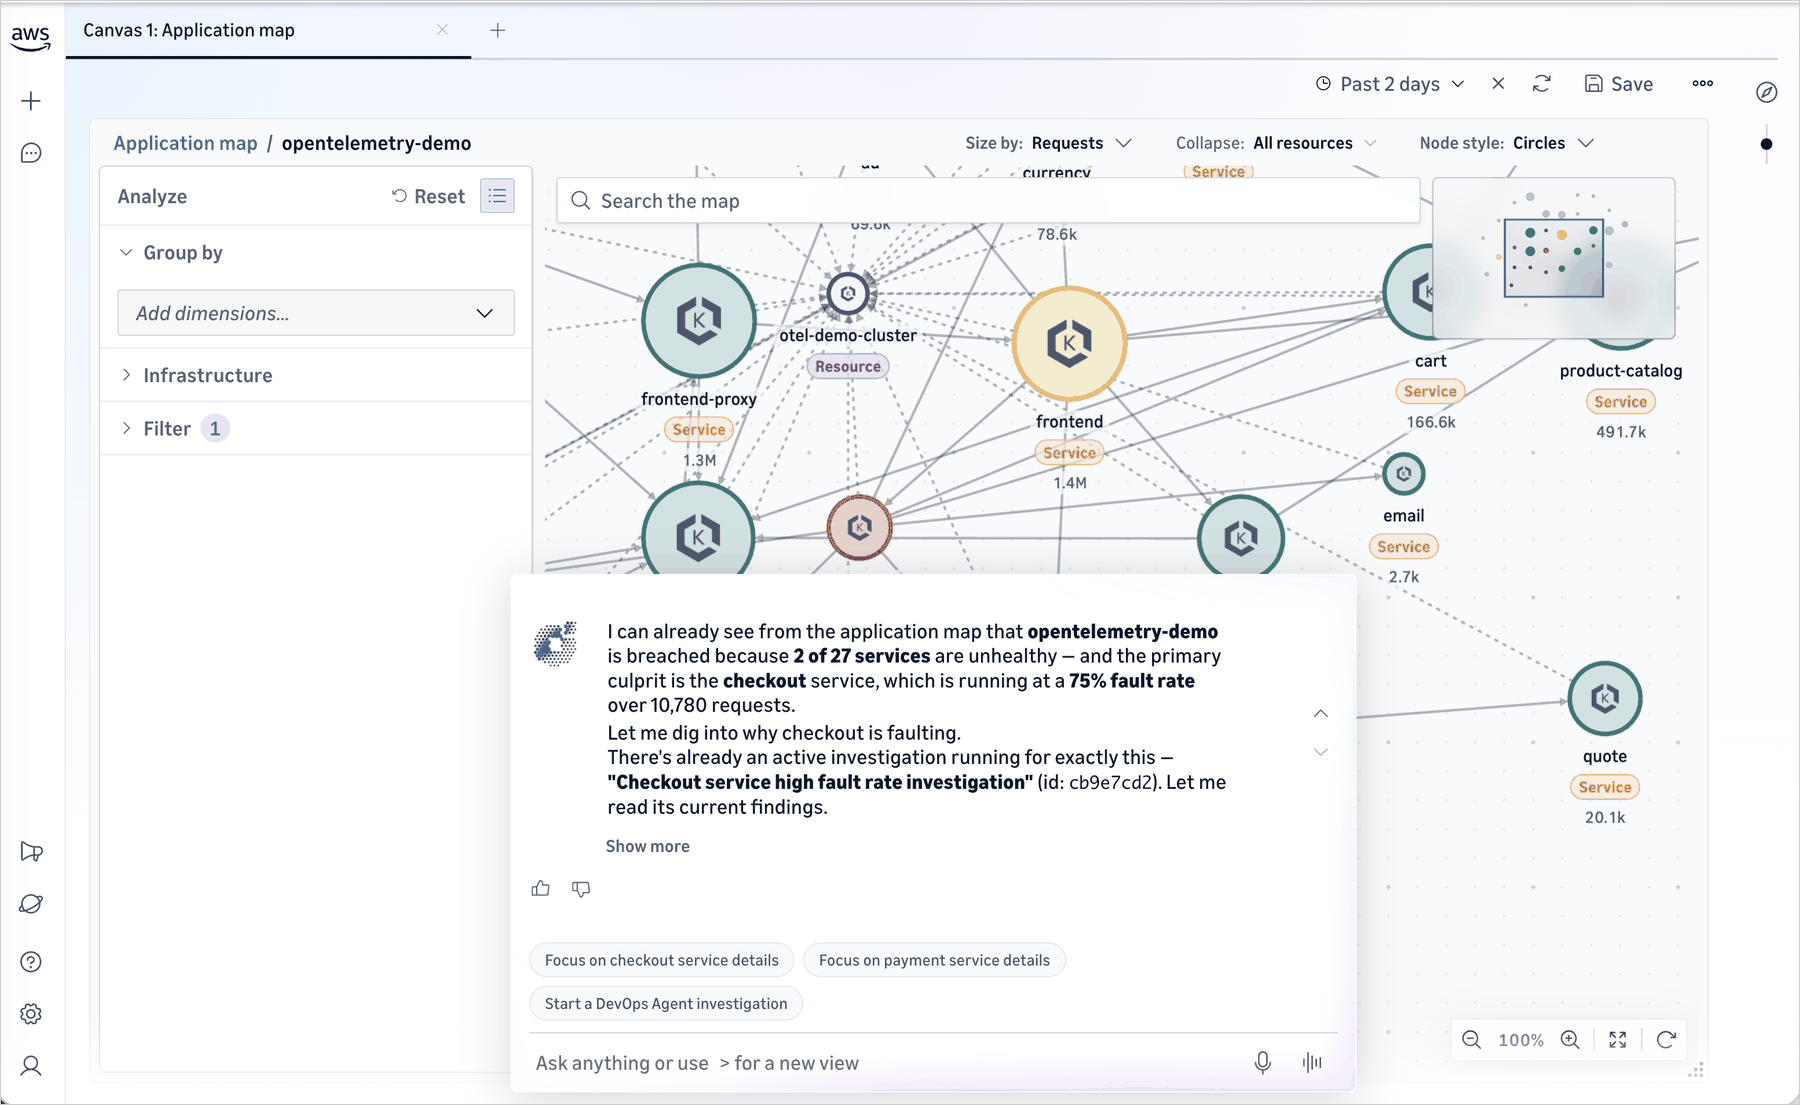
CloudWatch Omni integrates the Amazon DevOps Agent, an advanced AI collaborator that actively participates in investigation sessions. Crucially, the DevOps Agent operates directly on the same telemetry data visible to human engineers, ensuring that its insights are grounded in the actual, current state of the application. The agent performs several critical functions:
Signal Correlation: Automatically links disparate events, such as correlating a recent deployment timestamp with a sudden rise in latency.
Root-Cause Pathfinding: Traces failure paths across complex dependency graphs to pinpoint the exact origin of a bottleneck.
Context Preservation: Maintains an automated, immutable history of the investigation, effectively generating a comprehensive incident report without requiring manual documentation.
Inside an Incident Workflow: How CloudWatch Omni Operates
To visualize the practical impact of CloudWatch Omni, consider a standard incident response lifecycle within an enterprise e-commerce platform:
Anomaly Detection and Automated Alerting: An alarm triggers due to elevated error rates within the core checkout microservice. Rather than presenting a raw, isolated metric, CloudWatch Omni opens a dedicated investigation session. The interface instantly displays the service topology, highlights a code deployment that occurred ten minutes prior, and flags an increased latency metric originating from a downstream third-party payment API.
Initial Triage by the On-Call SRE: The on-call Site Reliability Engineer reviews the initial dashboard, confirms the temporal correlation between the deployment and the error spike, and uses the integrated trace view to isolate the specific failing API endpoints. They also review the Amazon DevOps Agent’s initial analytical summary.
Seamless Escalation and Cross-Team Collaboration: Recognizing that the bottleneck stems from the payment infrastructure, the SRE escalates the issue to the payments engineering team. The payments engineer joins the active Omni session with a single click. Without needing any verbal recap or screenshot sharing, they immediately view all telemetry gathered thus far, alongside the DevOps Agent’s correlation analysis pointing toward an unexpected configuration change within the payment provider’s API gateway.
Resolution and Automated Documentation: The payments team rolls back the faulty configuration change, restoring normal operations. Because CloudWatch Omni records the entire telemetry trail, chat logs, and agent interactions within the investigation session, the post-incident review data is captured automatically, eliminating the need to draft manual post-mortems from scratch.
Step-by-Step Implementation: Setting Up Your First Space
Deploying CloudWatch Omni within an enterprise environment is designed to be frictionless, requiring minimal setup time and no disruption to existing telemetry pipelines.
Step 1: Initialization and Identity Configuration
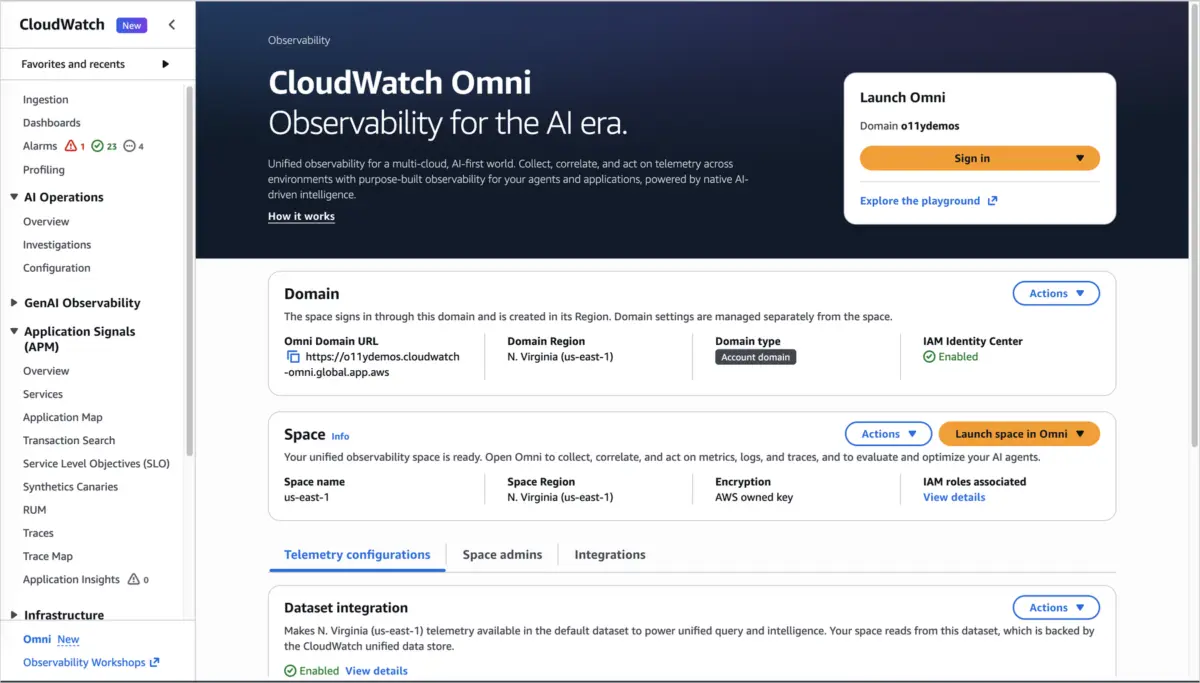
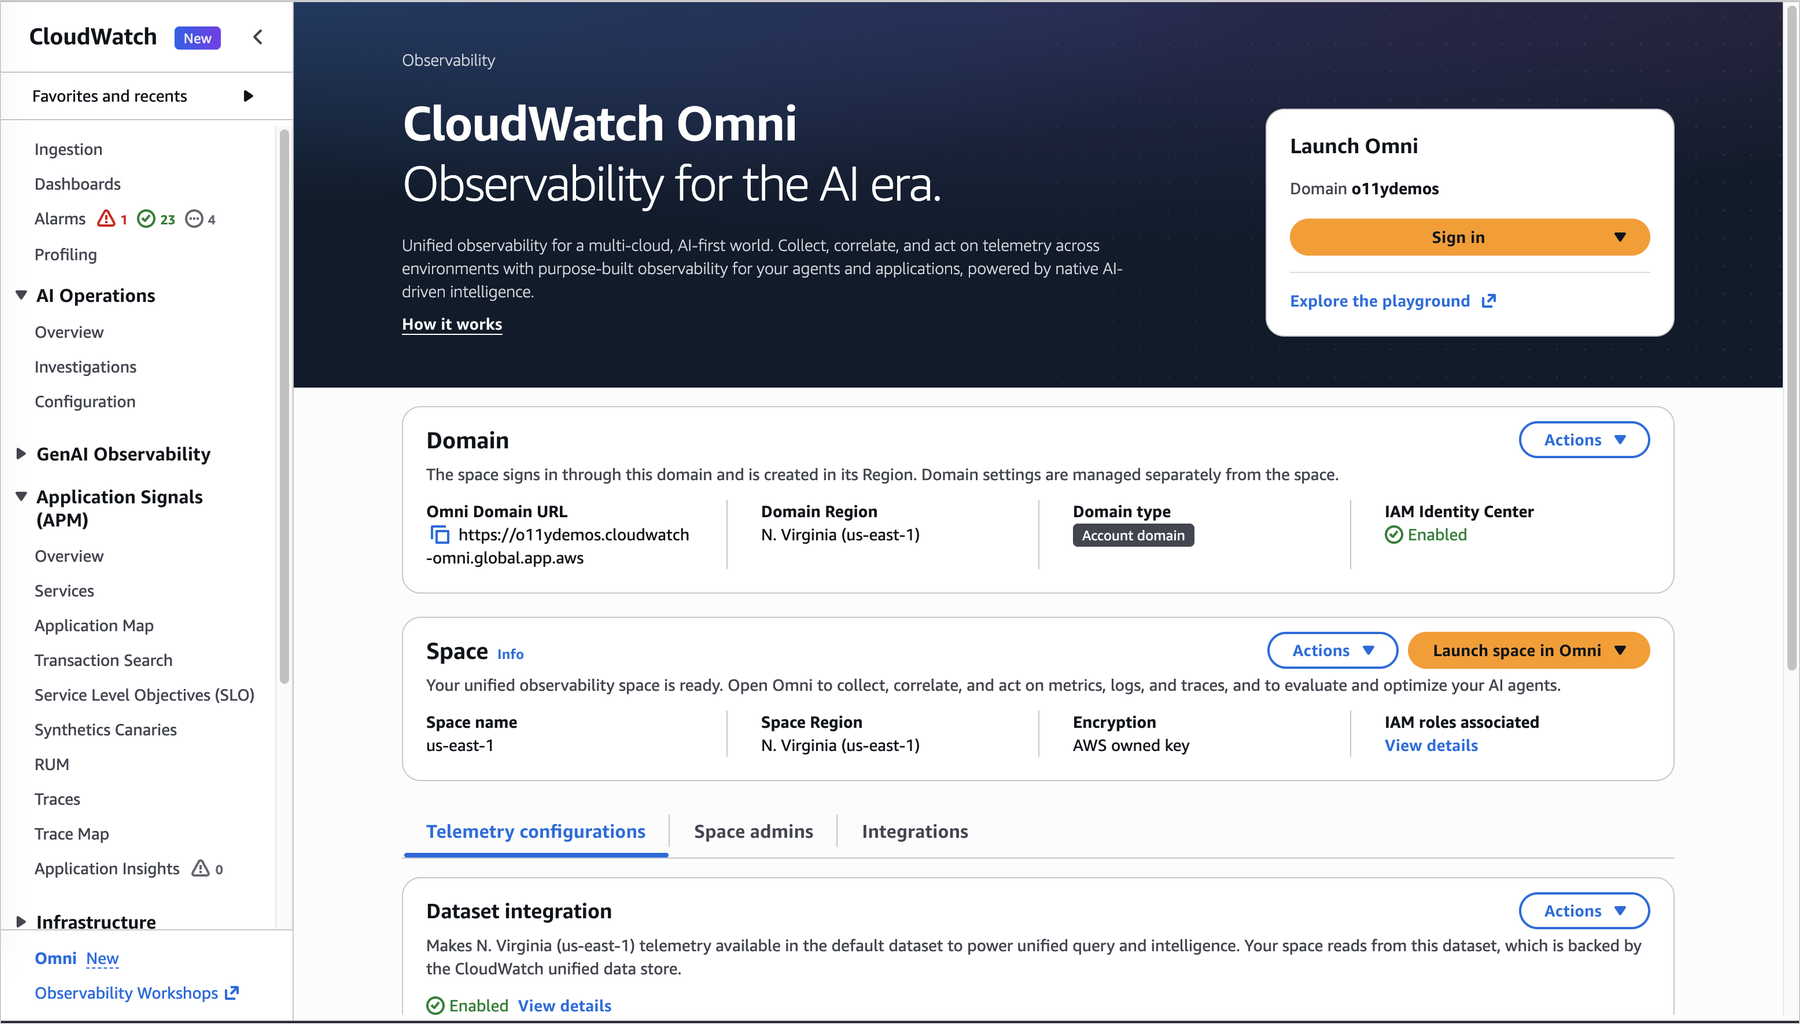
An enterprise administrator initiates the process directly from the Amazon CloudWatch console by selecting the "Try CloudWatch Omni" option. Next, the administrator connects the organization’s preferred identity provider (such as Okta, Microsoft Entra ID, or any SAML 2.0-compliant provider) via AWS IAM Identity Center. This establishes secure, role-based access, allowing team members to log into a dedicated organizational URL without requiring direct credentials for the AWS Management Console.
Step 2: Creating Team "Spaces"
Within Omni, monitoring is organized around "Spaces." A Space acts as a dedicated collaborative workspace grouping the specific applications owned by a given engineering team, along with all associated telemetry data. Crucially, creating a Space does not involve data duplication or migration; it simply creates a logical pointer to existing CloudWatch logs, metrics, traces, and alarms.
Step 3: Automated Discovery and Topology Mapping
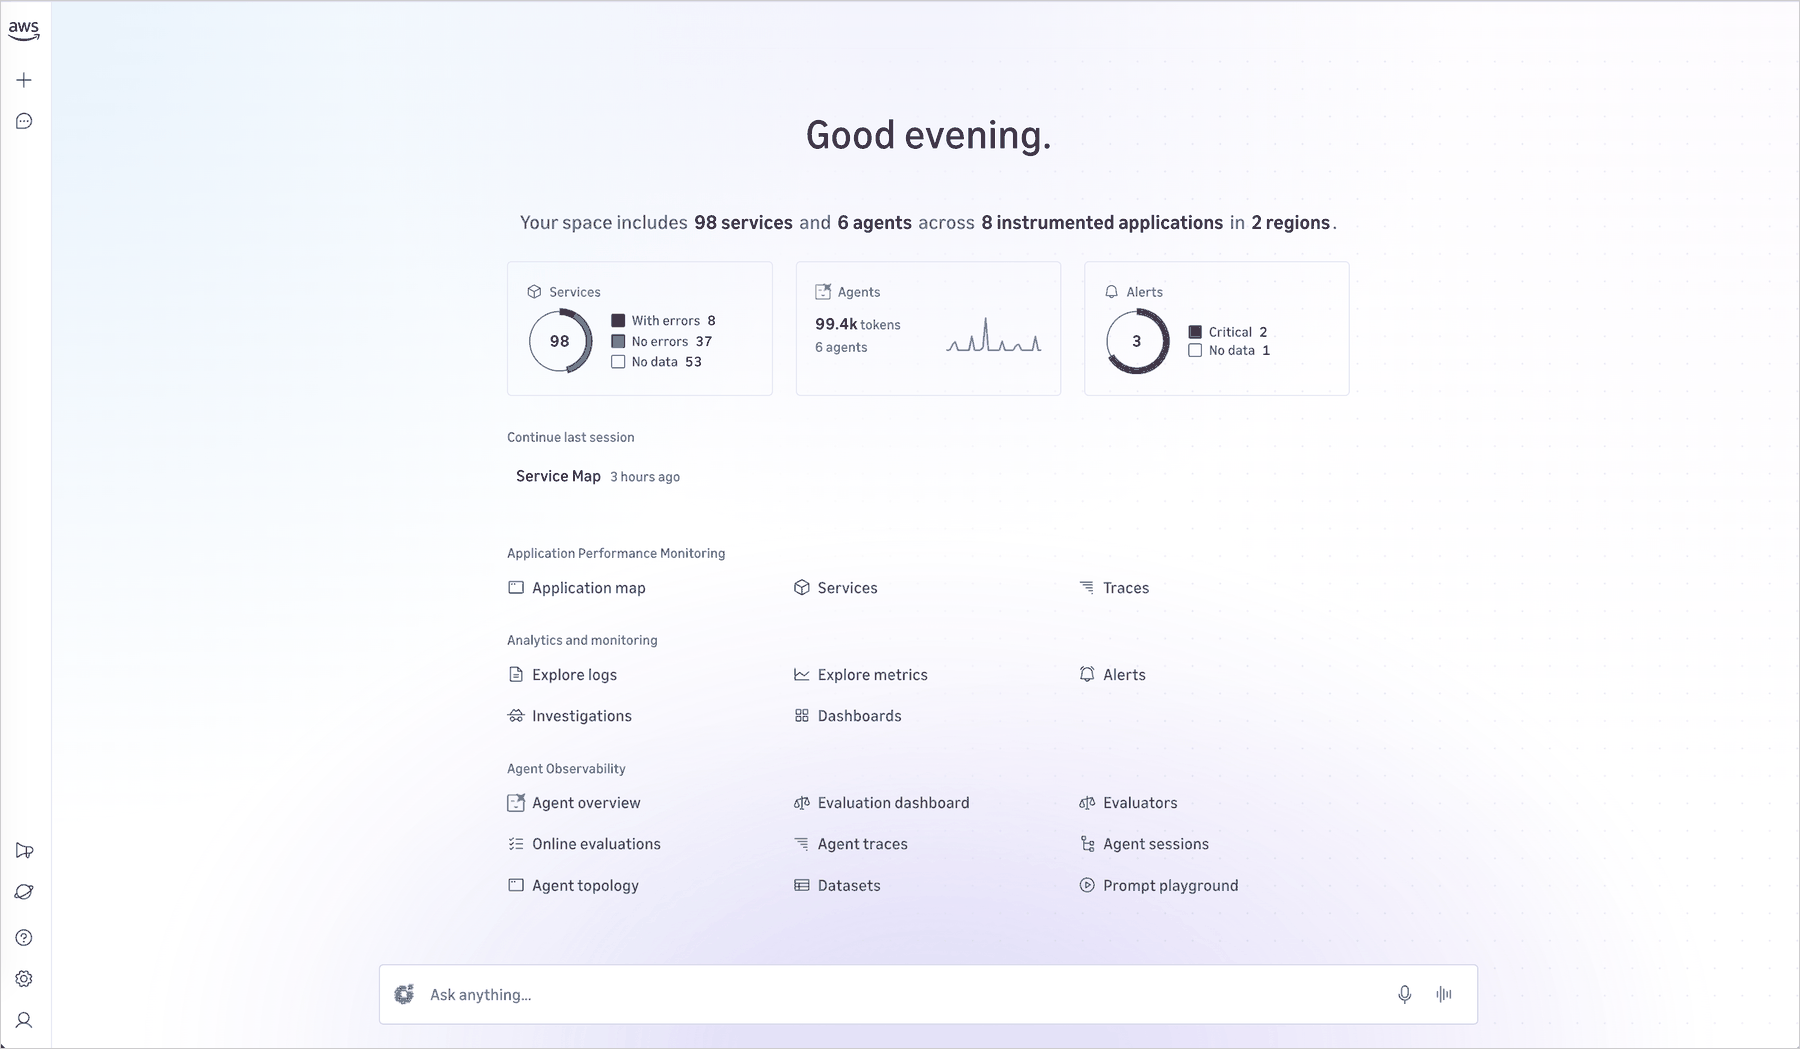
Once a Space is established, CloudWatch Omni immediately begins scanning incoming OpenTelemetry and AWS Config data. It automatically discovers active microservices, maps out inter-service dependencies, and generates a comprehensive, real-time visual topology map.
Step 4: Natural Language Querying and AI Diagnostics
Engineers can interact with their observability data using plain English. By typing queries directly into the Omni interface, users can ask complex analytical questions—such as "Show me all database timeout errors occurring across services dependent on the user-authentication module over the last two hours"—and receive immediate, visualized insights. Furthermore, teams can trigger the Amazon DevOps Agent to analyze service health alerts, interrogate telemetry streams, and formulate actionable mitigation strategies during active incidents.
Official Statements and Industry Implications
Industry analysts and AWS leadership emphasize that CloudWatch Omni represents a fundamental evolution in how organizations approach software reliability.
"Engineering teams have spent too long acting as human glue between disconnected observability tools," noted Daniel Abib in the official AWS release notes. "By organizing telemetry around applications rather than infrastructure components, and by bringing human expertise together with autonomous AI agents in a unified workspace, CloudWatch Omni drastically reduces cognitive load and accelerates resolution times."
The platform’s native support for OpenTelemetry ensures that enterprises are not locked into proprietary data ingestion formats. Whether workloads run natively on Amazon Elastic Compute Cloud (Amazon EC2), Amazon Elastic Kubernetes Service (Amazon EKS), on-premises data centers, or multi-cloud environments, their telemetry can be unified into a single Omni workspace via OTLP endpoints.
Furthermore, the introduction of specialized observability for generative AI and agentic workflows addresses an urgent industry blind spot. As enterprises rapidly transition from experimental AI proofs-of-concept to mission-critical, autonomous agentic systems, maintaining visibility into model behavior, token consumption, and multi-step agent execution chains is paramount. Omni’s dual focus on traditional application monitoring and cutting-edge AI observability positions it as a comprehensive solution for modern software architectures.
Future Outlook: The Next Frontier of Autonomous Operations
As software systems grow increasingly distributed, autonomous, and complex, traditional reactive monitoring is no longer sufficient. The launch of Amazon CloudWatch Omni signals a decisive industry transition toward autonomous, collaborative, and application-centric observability.
Looking ahead, we can expect observability platforms to evolve further along several key trajectories:
Deeper Agentic Integration: Future iterations of AI agents like the Amazon DevOps Agent will likely move beyond diagnostic assistance into autonomous remediation, automatically executing pre-approved rollback scripts, patching configuration drifts, and scaling resources proactively before human intervention is required.
Unified Multi-Cloud and Hybrid Telemetry: As enterprises continue to distribute workloads across diverse cloud providers and edge locations, tools that abstract underlying infrastructure differences—much like Omni’s OpenTelemetry integration—will become the gold standard for enterprise architecture management.
Proactive SLO Management: Shifting from reactive alerting to predictive service level objective (SLO) management will allow engineering teams to anticipate user-facing degradation based on subtle shifts in telemetry patterns well before alarms are triggered.
Getting Started
Amazon CloudWatch Omni is generally available today. Existing CloudWatch customers can begin exploring the platform immediately by navigating to the Amazon CloudWatch console and selecting "Try CloudWatch Omni." Organization-wide deployments can be configured in minutes by setting up IAM Identity Center integration, defining team Spaces, and connecting external OpenTelemetry data sources as needed.
For detailed pricing structures, feature specifications, and troubleshooting resources, engineering leaders are encouraged to visit the official Amazon CloudWatch Pricing Page and consult the AWS MCP Server documentation for integrating AI-assisted tooling into their operational workflows.