
Executive Overview
In an era defined by hyper-distributed cloud architecture, microservices, and the rapid integration of generative artificial intelligence, application observability has reached a critical inflection point. Engineering teams no longer struggle merely with a lack of data; they are overwhelmed by a deluge of fragmented signals. SREs (Site Reliability Engineers), DevOps professionals, and backend developers spend an inordinate percentage of their incident-response lifecycles manually curating static dashboards, constantly re-tuning alert thresholds, and hopping between disparate tools to piece together the forensic trail of an outage. When incidents cross team boundaries, crucial contextual data is frequently lost in fleeting Slack channels, scattered screenshots, and unorganized post-mortems.
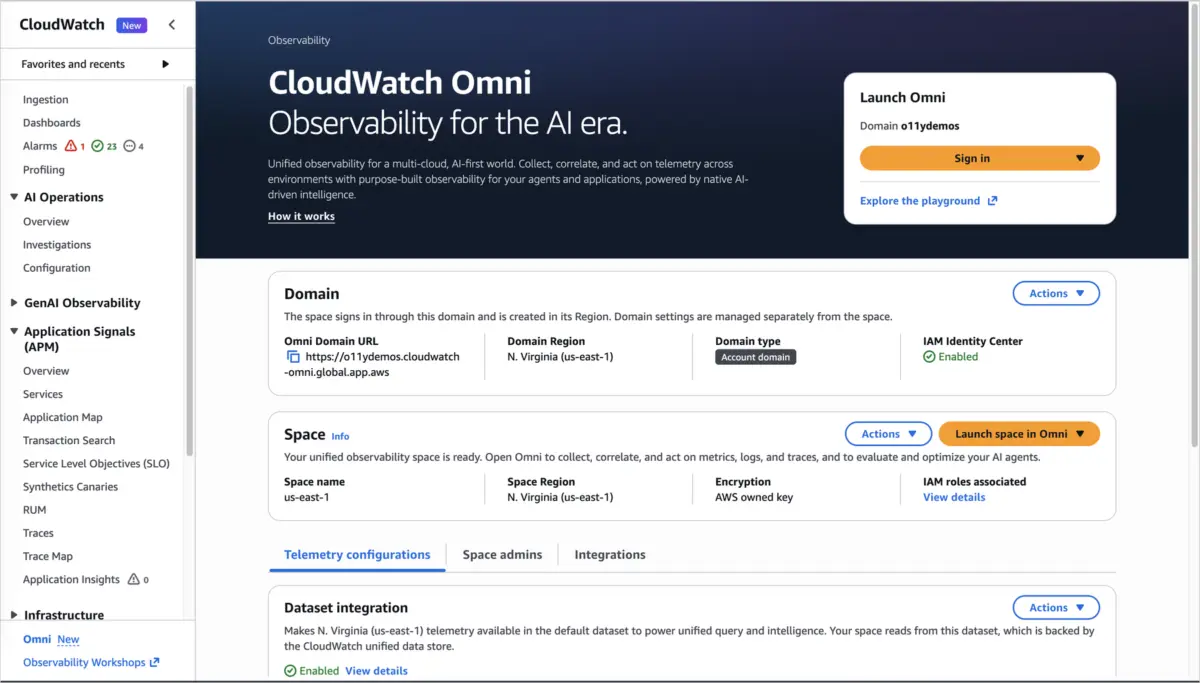
To permanently alter this paradigm, Amazon Web Services (AWS) has officially announced Amazon CloudWatch Omni, a next-generation, AI-powered observability experience explicitly designed to manage complex applications and autonomous AI agents in tandem. Built natively on OpenTelemetry (OTel)—allowing telemetry data to stream seamlessly into the platform without complex reconfiguration—CloudWatch Omni transitions the observability model away from isolated metrics and infrastructure components toward holistic, application-centric visualization.
By integrating enterprise-grade single sign-on (SSO) independent of the AWS Management Console, dynamic application topology mapping, and the sophisticated reasoning engine of the Amazon DevOps Agent, Omni unifies cross-functional engineering silos into a single, collaborative workspace. Whether an organization is running traditional containerized microservices or cutting-edge generative AI agentic workflows, CloudWatch Omni promises to drastically shorten Mean Time to Resolution (MTTR), automate root-cause discovery through natural language interaction, and eliminate the administrative burden of traditional dashboard maintenance.
Detailed Chronology: The Evolution of CloudWatch and the Genesis of Omni
The Fragmented State of Legacy Observability
Historically, observability tooling evolved alongside the infrastructure it monitored. Cloud platforms provided robust primitives: metrics for utilization, logs for transactional records, and traces for distributed call flows. However, as organizations shifted from monolithic systems to microservices, and subsequently to event-driven serverless and generative AI architectures, the volume of telemetry exploded exponentially.
Engineering organizations routinely built dozens, if not hundreds, of static dashboards for every service they maintained. Tuning these dashboards required constant manual intervention; thresholds that were appropriate during baseline operations proved overly noisy during traffic spikes, leading to alert fatigue. Furthermore, when an incident occurred—such as a cascading failure originating in a third-party payment gateway and rippling through checkout services—teams were forced to manually correlate timestamps across logs, traces, and metrics dashboards.
Recognizing the Need for Unified Workspaces
Recognizing that tool-switching and context degradation were the primary bottlenecks in incident response, AWS engineers began conceptualizing an observability layer that operated above raw infrastructure metrics. The objective was clear: build a centralized workspace where the application itself—rather than the underlying compute resource or database—served as the primary unit of organization.
This vision coalesced around OpenTelemetry as the universal standard for telemetry collection. By standardizing ingestion through OpenTelemetry Protocol (OTLP) endpoints, AWS ensured that developers could adopt Omni without overhauling their existing instrumentation pipelines. Concurrently, advancements in generative AI and large language models enabled the creation of autonomous agentic assistants capable of reasoning over complex, multi-service telemetry graphs.
The Launch of CloudWatch Omni
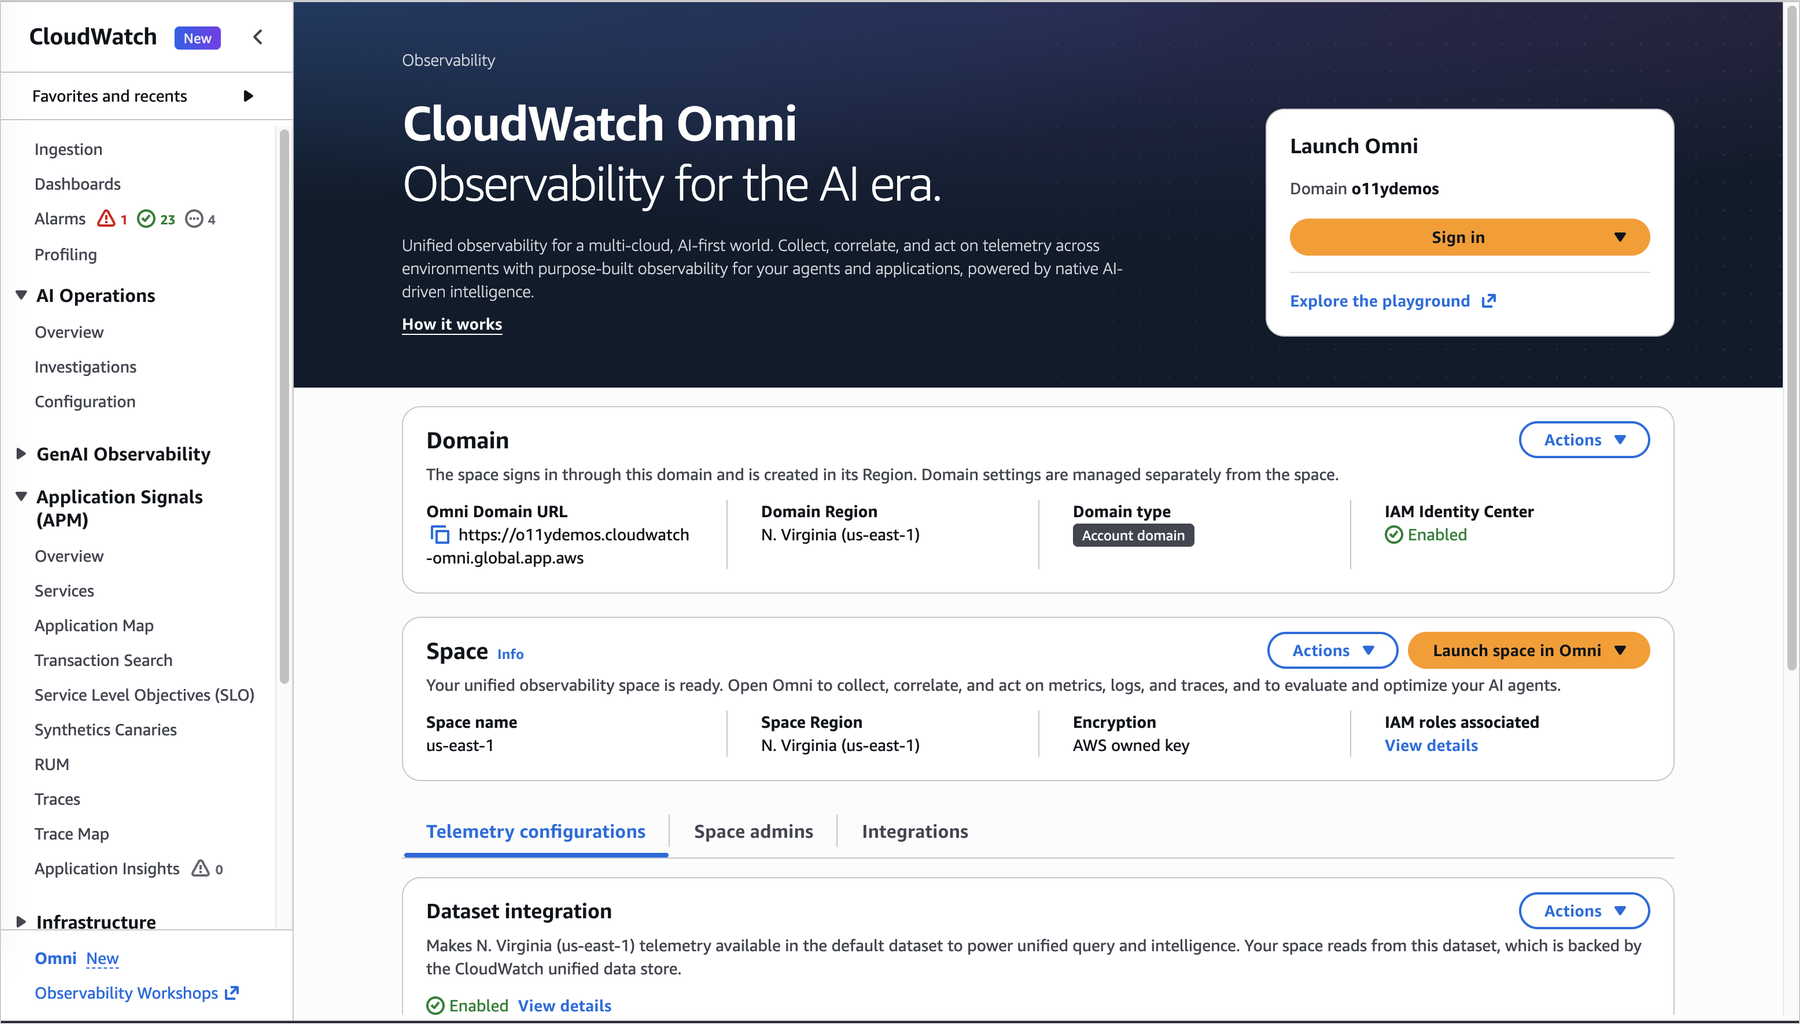
The formal introduction of CloudWatch Omni marks a watershed moment for AWS observability. Released simultaneously with comprehensive agent observability capabilities for generative AI workloads, Omni introduces a dedicated organizational URL infrastructure. This decoupling from the standard AWS Management Console allows non-traditional AWS users—such as product managers, database administrators, and specialized software engineers—to participate actively in debugging sessions without requiring granular IAM permissions or console access.

Supporting Context & Metrics: How CloudWatch Omni Solves Engineering Pain Points
CloudWatch Omni directly addresses three core friction points identified by engineering leadership across the enterprise technology sector: team fragmentation, dashboard maintenance fatigue, and the complexity of root-cause isolation.
1. Unified Collaborative Spaces
Traditionally, when a P1 incident occurred, engineers opened individual browser tabs, queried logs independently, and pasted snippets into messaging apps. This fragmented investigation trail made handoffs between on-call rotas difficult and prone to missing context.
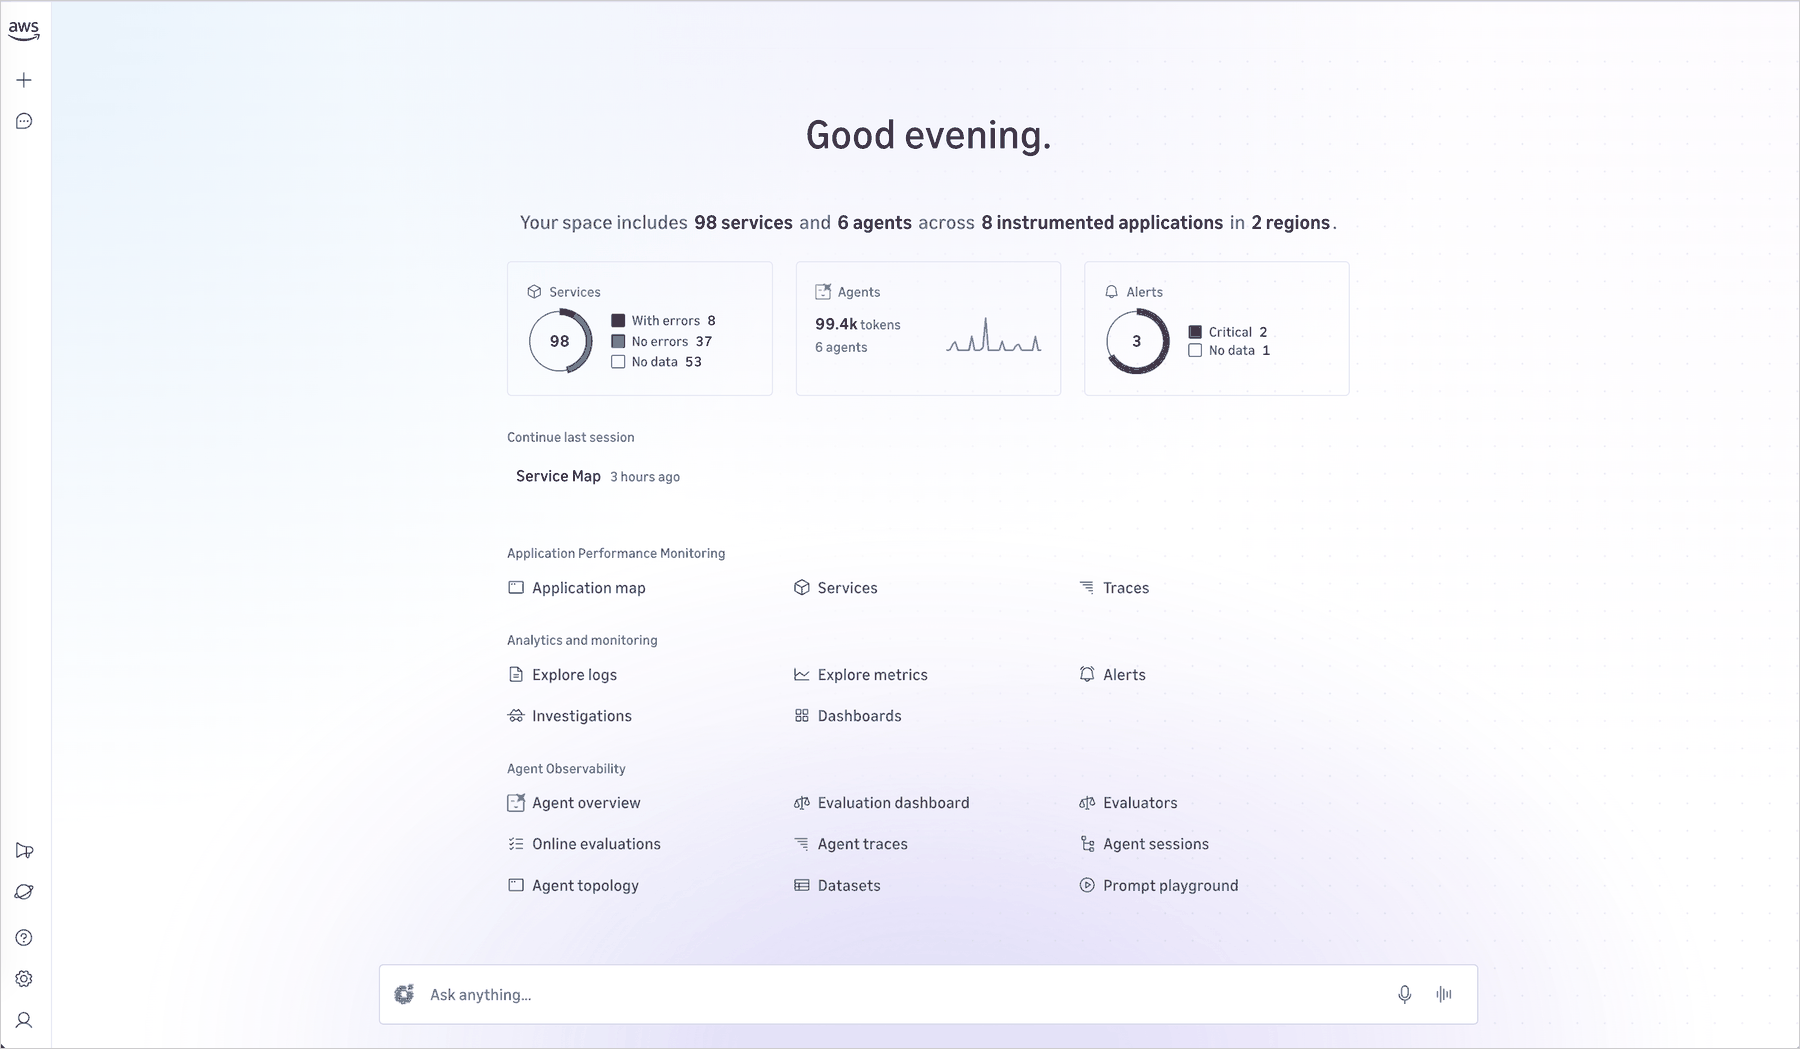
CloudWatch Omni resolves this by introducing dedicated Spaces. A Space functions as a collaborative operational workspace that groups the applications owned by a specific engineering unit alongside all associated telemetry. Accessible via enterprise single sign-on (SSO) through AWS IAM Identity Center—with native support for identity providers like Okta, Azure AD, and any SAML 2.0-compliant provider—every stakeholder joins the exact same session. When an SRE escalates an issue to a database or payments specialist, the incoming engineer inherits the complete chronological and analytical history of the investigation instantly.
2. Adaptive System Topology and Dynamic Views
Manual dashboard creation is widely regarded by infrastructure teams as an administrative tax. Systems change continuously; new microservices are deployed, deprecated APIs are retired, and scaling events alter network pathways. Static dashboards break or become obsolete almost immediately.
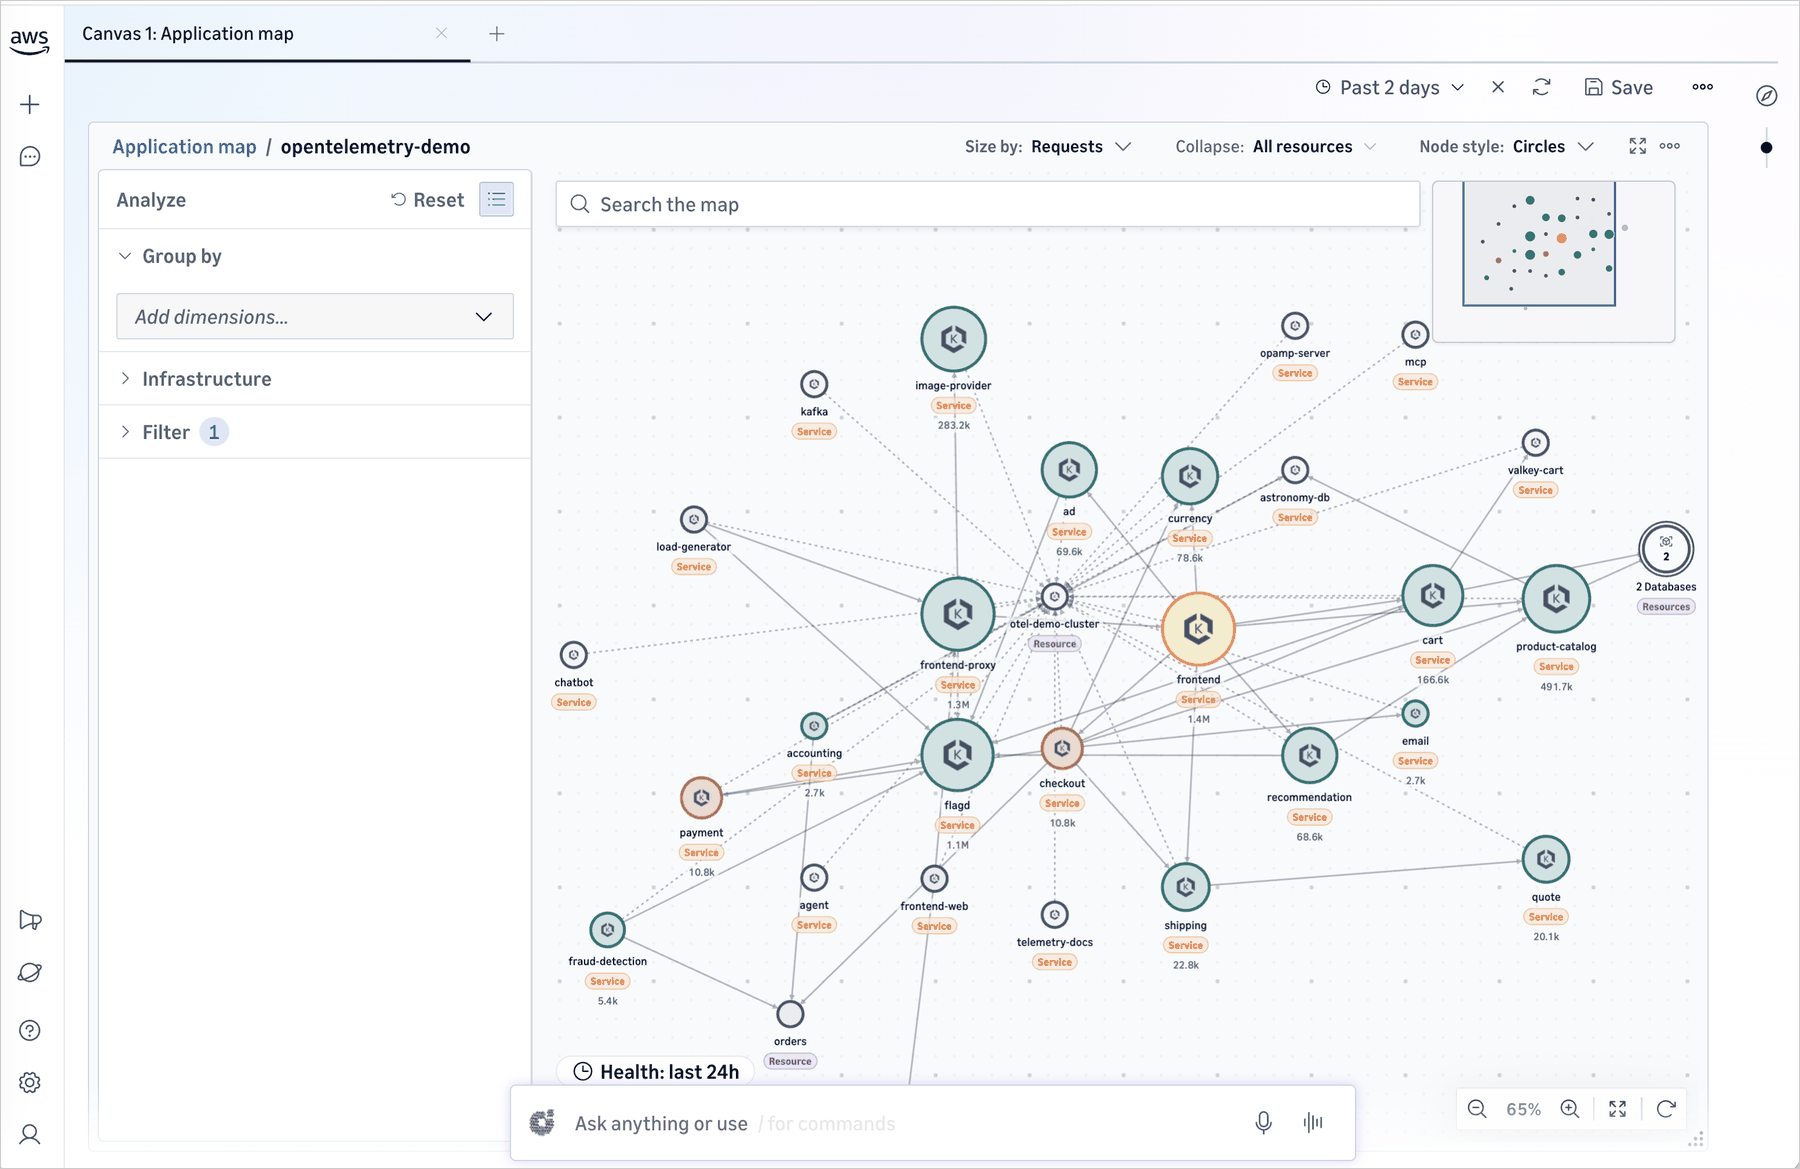
Omni fundamentally shifts this burden to the platform itself. Through automated resource discovery via AWS Config and OpenTelemetry instrumentation, CloudWatch Omni continuously discovers services, maps inter-service dependencies, and constructs a live application topology map. Instead of tweaking individual chart thresholds, engineering teams declare high-level operational targets—such as availability targets, latency budgets, and error rate thresholds. As the underlying system evolves, Omni dynamically updates its monitoring views and alerts without human intervention.
3. AI-Powered Investigation with Amazon DevOps Agent
Perhaps the most transformative feature of CloudWatch Omni is the integration of the Amazon DevOps Agent. Rather than acting as a static search utility, the DevOps Agent participates dynamically as a virtual member of the incident response team.
Operating directly on the telemetry visible to human engineers, the agent performs advanced cross-signal correlation. When an anomaly is detected, the DevOps Agent autonomously traces root-cause paths through the dependency graph, correlates recent code deployments or configuration changes with error spikes, and suggests concrete remediation steps. Crucially, the agent automatically captures the entire narrative of the investigation, compiling a complete audit trail that replaces the need for manual post-incident reporting.
Typical Incident Workflow in Action
To understand the practical impact of CloudWatch Omni, consider a standard production outage scenario:
- The Trigger: An alarm fires indicating elevated error rates within the primary checkout microservice.
- Automated Triage: Omni instantly instantiates an investigation session. The dashboard displays the live service topology, highlights a recent deployment that occurred 10 minutes prior, and shows a concurrent surge in latency originating from a downstream payment API. The Amazon DevOps Agent presents its initial root-cause hypothesis.
- Human Validation: The on-call SRE reviews the telemetry, confirms the correlation with the recent deployment, and drills down into distributed traces to isolate specific failing endpoints.
- Seamless Escalation: Recognizing the issue extends beyond internal code, the SRE invites a payments engineer into the same Omni session. The payments engineer immediately sees all prior context, alongside an automated finding from the DevOps Agent linking the latency to a recent configuration change at the payment provider’s API gateway.
- Mitigation and Automated Documentation: The team identifies the faulty configuration, executes a rollback, and verifies system recovery. The entire investigation session is archived automatically as the definitive incident report.
Official Statements and Architectural Philosophy
Industry observers note that CloudWatch Omni represents a philosophical shift in how cloud providers view monitoring. Rather than treating logs, metrics, and traces as raw commodities to be stored and queried independently, AWS is positioning observability as an interactive, collaborative discipline driven by artificial intelligence.
In technical briefings accompanying the launch, AWS engineering leads emphasized that observability must align with human organizational structures rather than underlying cloud primitives.
"Engineering teams should not have to spend their valuable time acting as glue between disparate monitoring tools, nor should they be forced to maintain rigid dashboards for systems that are inherently fluid and fast-evolving," noted Daniel Abib in the foundational AWS release documentation. "CloudWatch Omni bridges the gap between raw OpenTelemetry data and human collaboration. By bringing everyone into a single, context-rich Space powered by the Amazon DevOps Agent, we are transforming incident response from a chaotic forensic exercise into a streamlined, guided workflow."
Furthermore, architectural architects have highlighted the zero-migration design principle underpinning Omni. Existing CloudWatch customers do not need to rewrite ingestion pipelines or shift historical data stores. Omni overlays seamlessly onto existing data lakes of logs, metrics, and alarms, respecting current storage configurations while unlocking advanced topological mapping and natural language querying capabilities.
Future Outlook: The Convergence of Generative AI and Observability
The launch of CloudWatch Omni signals a broader industry trend: the convergence of observability platforms with generative AI agents. As enterprise applications increasingly incorporate complex multi-agent LLM workflows alongside traditional microservices, monitoring tools must evolve to comprehend non-deterministic system behaviors.
Omni’s dual support for both traditional application observability and purpose-built generative AI agent observability positions AWS at the forefront of this architectural shift. Future iterations of systems management will likely rely even more heavily on natural language interfaces, where engineers query entire enterprise topologies using conversational syntax ("Show me all database bottlenecks caused by upstream token-generation failures over the last two hours") and delegate remediation workflows to trusted autonomous agents.
For organizations seeking to deploy CloudWatch Omni, adoption is frictionless. Existing customers can initiate their first Space directly from the Amazon CloudWatch console by selecting "Try CloudWatch Omni," configuring their corporate identity provider via IAM Identity Center, and instantly engaging their teams in a unified, intelligent observability workspace. As cloud architectures continue to scale in complexity, tools like CloudWatch Omni will transition from being optional operational enhancements to absolute necessities for enterprise resilience.