

Executive Overview
In the modern digital economy, a website is rarely just a static brochure; it is a complex, dynamic application ecosystem. Yet, for decades, the cornerstone of web reliability engineering has relied on a surprisingly rudimentary diagnostic tool: the HTTP status check. Every few minutes, automated monitoring scripts ping a server, wait for a response, and—upon receiving a reassuring 200 OK—illuminate a green indicator on a dashboard. To the site owner, all appears well.
However, a critical disconnect has emerged between server availability and actual user experience. A web server can happily return an HTTP 200 status code while the application’s core features are completely crippled. Behind that deceptive green light, shopping carts may fail to process checkouts, vital JavaScript bundles might throw uncaught exceptions, responsive mobile layouts can violently collapse, and essential SEO metadata can silently vanish from the Document Object Model (DOM).
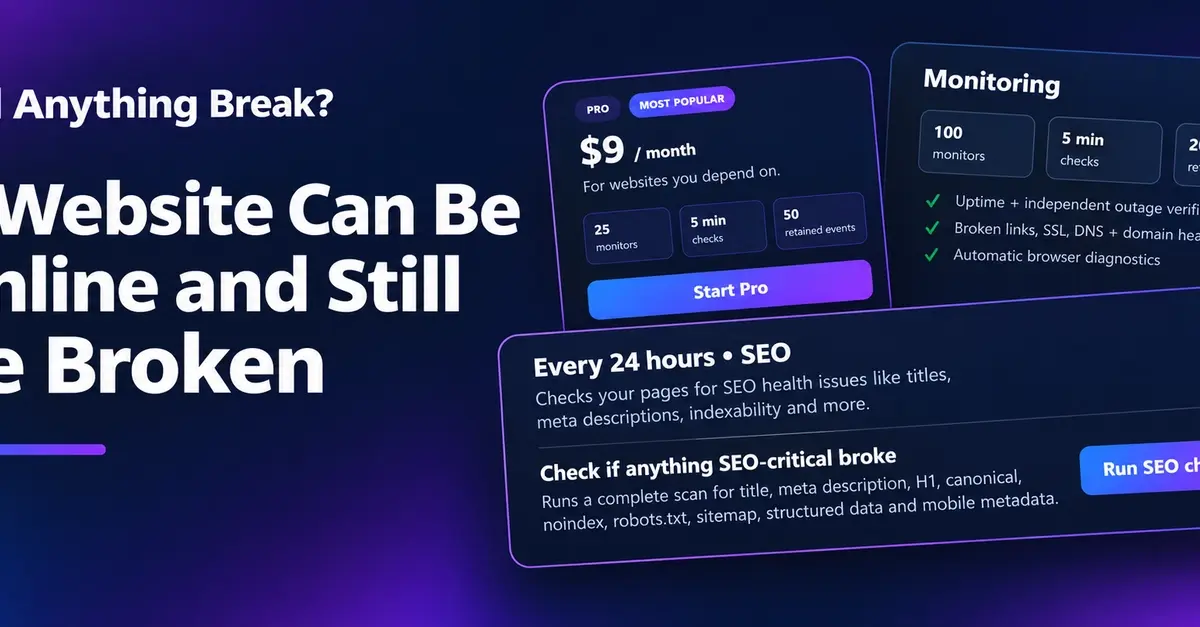
This persistent blind spot in web monitoring inspired the creation of Did Anything Break?, a next-generation diagnostic platform designed to shift the industry’s perspective. Rather than merely asking, “Is the server responding?” modern web reliability requires a more holistic, user-centric inquiry: “Is the website actually working?”
This report investigates the architectural limitations of legacy uptime monitors, explores the multi-layered vulnerabilities threatening modern web assets, details the anatomy of comprehensive website health checks, and examines the future outlook of automated synthetic monitoring as businesses demand deeper, more intelligent observability.
Detailed Chronology: The Evolution of Web Monitoring and the Uptime Fallacy
To understand why traditional monitoring is no longer sufficient, we must examine how web architectures—and the tools designed to watch over them—have evolved over the last thirty years.
Phase 1: The Static Web and the Birth of Ping (Late 1990s – Early 2000s)
In the early days of the internet, websites consisted primarily of static HTML files served over basic HTTP protocols. If a web server was powered on, connected to the internet, and capable of returning a file, the site worked. During this era, monitoring tools were straightforward: they sent a basic network ping or an HTTP GET request. If the server responded with a success code, the site was deemed healthy. This binary metric—online versus offline—was entirely adequate for the technological demands of the time.
Phase 2: The Rise of Dynamic Applications and Client-Side Complexity (2010s)
As broadband speeds increased and web development matured, static pages gave way to rich, dynamic web applications. Technologies like AJAX, Single Page Applications (SPAs) built on React, Vue, and Angular, and complex microservice backends transformed browsers into execution environments.
Suddenly, a website was no longer just a document delivered by a server; it was a complex assembly of client-side code, third-party APIs, CDNs, and database queries executed in real time. Despite this monumental shift in how web applications functioned, the monitoring industry largely clung to legacy methods. Engineers continued to rely on basic HTTP pings that checked server reachability while ignoring whether the browser could successfully render the interface or execute user-facing scripts.
Phase 3: The Broken Promise of the 200 OK (Present Day)
Today, web engineers face a litany of catastrophic failures that bypass traditional monitoring entirely. A deployment can introduce a subtle JavaScript syntax error that halts execution, rendering an entire pricing page unclickable. An expired SSL intermediate certificate or a misconfigured DNS record can block mobile users while desktop users on cached networks glide through uninterrupted. Search engine crawlers encountering a broken rendering script may find a completely blank page, destroying organic search rankings overnight—all while legacy monitors proudly display uninterrupted 100% uptime.
Recognizing this profound industry vulnerability, developers and site reliability engineers began searching for a unified solution that could bridge the gap between infrastructure uptime and functional usability. This realization catalyzed the development of holistic testing methodologies, ultimately leading to platforms that simulate real-world user interactions rather than mere server handshakes.
Supporting Context & Metrics: The Hidden Anatomy of Website Failures
To appreciate the necessity of comprehensive monitoring, one must dissect the layers of a modern web application and understand where standard infrastructure monitoring inevitably falls short.
[ Traditional Monitoring ] ---> Asks: "Is the server alive?" (HTTP 200 OK)
                                       │
                                       ▼
[ Modern User Experience ] ---> Asks: "Does the site actually work?"
                                       ├── Browser Execution (JS/APIs)
                                       ├── Mobile Responsive Layouts
                                       ├── SSL/DNS Integrity
                                       └── SEO-Critical Infrastructure
1. HTTP Monitoring: The Baseline (Necessary, But Insufficient)
HTTP monitoring remains the foundational layer of web observability. It verifies that a server is listening on port 80 or 443 and returning a valid HTTP status. While indispensable for detecting catastrophic infrastructure failures—such as server crashes, hosting provider outages, or severe network partitions—it provides zero insight into application-level health. It is equivalent to checking if a storefront’s lights are on without verifying whether the doors are unlocked or the cash registers are working.
2. Headless Browser Checks
To capture what users actually experience, modern monitoring must incorporate headless browser checks (utilizing tools like Puppeteer or Playwright). A real browser executes JavaScript, evaluates CSS stylesheets, initializes DOM elements, and triggers asynchronous API calls.
- Uncaught Exceptions: Browser checks can detect if a critical script fails to load, halting the execution thread.
- Broken Interactions: Automated scripts can simulate user journeys, such as clicking a "Buy Now" button or submitting a contact form, ensuring that underlying database connections and API endpoints are responding correctly.
3. Mobile Layout and Responsive Design Integrity
Over 55% of global web traffic originates from mobile devices. However, many enterprise websites are tested primarily on high-resolution desktop monitors during development. This creates a dangerous blind spot for mobile layout failures:
- Horizontal Overflow: Unconstrained CSS elements can cause pages to stretch horizontally on smaller screens, forcing users to endlessly scroll sideways.
- Misplaced Elements: Critical call-to-action buttons can overlap or get pushed below the fold, rendering them unclickable on smartphones.
- Collapsed Navigation: Responsive hamburger menus can break due to conflicting script libraries, completely locking mobile users out of the site navigation.
4. SSL Certificates and DNS Health
Infrastructure stability is notoriously fragile. Domain Name System (DNS) configurations can be accidentally altered, and SSL/TLS certificates can expire or encounter chain-of-trust validation issues. A website may have flawless server code, but if a DNS record points to a decommissioned IP address or an SSL certificate throws a security warning in modern browsers, the user experience is instantly severed. Proactive monitoring must continuously validate certificate expiration timelines and DNS record integrity.
5. SEO-Critical Infrastructure Checks
For content-driven businesses, e-commerce stores, and publishers, organic search traffic is the lifeblood of revenue. A website can remain technically "online" while simultaneously experiencing catastrophic SEO degradation. Silent failures in this category include:
- Broken or Missing Canonical Tags: Causing search engines to penalize the site for duplicate content.
- Accidental
noindexDirectives: Pushed to production during staging deployments, instantly wiping a site from search engine index results. - Broken Open Graph / Meta Tags: Ruining social media preview cards when links are shared across platforms.
- Malformed XML Sitemaps: Preventing search engine crawlers from indexing new products or blog posts.
Official Statements and Industry Insights
Industry veterans and reliability engineers have long criticized the over-reliance on basic server pings. In recent developer forums and infrastructure roundtables, thought leaders have emphasized that monitoring must pivot toward synthetic user monitoring (SUM) and experience-driven metrics.
"We have built hyper-resilient cloud infrastructures that rarely go completely offline, but our application complexity has skyrocketed. The threats to our revenue no longer come from power outages at data centers; they come from a bad JavaScript deployment, an expired security certificate, or a broken mobile layout. Measuring uptime without measuring usability is a false sense of security."
— Lead Infrastructure Architect, Enterprise SaaS Provider
Another prominent voice in the DevOps community noted:
"When a customer visits your site and encounters a broken checkout flow, they don’t care that your server returned an HTTP 200. To them, your business is down. Monitoring tools must evolve to adopt the customer’s perspective, testing the functional reality of the application rather than just the network layer."
This industry-wide philosophical shift has fueled the adoption of comprehensive auditing tools like Did Anything Break?, which bridges the gap between traditional uptime logging and holistic user-experience verification. By synthesizing multiple layers of analysis—from HTTP responses to SEO integrity and mobile layout rendering—site owners gain an uncompromising, accurate assessment of their digital storefronts.
Future Outlook: The Next Generation of Web Reliability
As web technologies continue to evolve with the integration of edge computing, serverless architectures, and AI-driven user interfaces, the approach to web monitoring must adapt accordingly.
1. Shift Toward Intent-Based Synthetic Monitoring
The future of website health tracking lies in intent-based synthetic monitoring. Rather than running static scripts that check predefined URLs, next-generation tools will leverage AI-driven agents capable of intelligently navigating web applications, discovering new user paths, and validating complex transactional flows dynamically.
2. Unified Observability Dashboards
Siloed monitoring—where server uptime is tracked in one tool, SSL expiration in another, and SEO audits in a third—is rapidly becoming obsolete. Businesses demand unified observability platforms that aggregate infrastructure health, functional browser checks, and compliance signals into a single pane of glass. Platforms like Did Anything Break? represent the vanguard of this movement, offering streamlined, multi-faceted diagnostics designed for modern web creators who need rapid, reliable answers to the fundamental question: Did anything break?
3. Proactive Remediation and Self-Healing Systems
As monitoring tools become more granular, the boundary between detection and remediation will blur. Future monitoring ecosystems will not only alert teams to broken mobile layouts or missing SEO tags but will also leverage automated rollback protocols and AI-assisted debugging to resolve minor configuration discrepancies before human intervention is required.
Conclusion
The green uptime indicator has served its purpose, but it belongs to an era of the internet that no longer exists. Today’s web applications are sprawling, dynamic, multi-layered ecosystems where reachability does not equal usability.
When a customer arrives at your digital doorstep, they do not care about HTTP 200 OK status codes; they care whether the page loads correctly, whether the buttons click, whether the mobile layout holds together, and whether the checkout process functions seamlessly.
Relying solely on legacy server pings is an invitation to silent revenue loss, brand damage, and undetected technical decay. By adopting comprehensive, user-centric diagnostic workflows—spanning browser execution, mobile responsiveness, infrastructure security, and SEO integrity—webmasters can finally move past the illusion of the green light and ensure their sites are truly, functionally alive.
To evaluate your website’s true health beyond basic server pings, you can test your application using the free diagnostic tool at https://didanythingbreak.tech.