
Executive Overview
In the high-stakes world of quantitative finance, the tools of the trade are rarely chosen through an "either/or" paradigm. Investment desks that utilize specialized analytical APIs like FlashAlpha almost invariably have Bloomberg Terminals installed on their trading floors. However, a narrower, more operationally critical question faces modern systematic desks: Can the terminal you already pay for reliably feed your systematic options research?
In most instances, the answer is no. This limitation stems not from a lack of data quality—Bloomberg’s foundational reference data is arguably the gold standard of the industry—but rather from a mismatch in architecture and licensing. Bloomberg is fundamentally engineered as an interactive workstation for human analysts and discretionary traders. FlashAlpha, by contrast, is purpose-built as a programmatic engine for models consuming REST APIs, WebSockets, and Model Context Protocol (MCP) servers.
Understanding this divide requires examining how modern quantitative research operates, the hidden operational bottlenecks of desktop APIs, and why specialized, single-layer analytics infrastructure has carved out an indispensable niche alongside legacy multi-asset giants.
Detailed Chronology and Architectural Evolution
The Shift from Human Screens to Model Pipelines
For decades, the Bloomberg Terminal reigned supreme as the ultimate window into global capital markets. Its architecture reflects its heritage: a monolithic ecosystem offering equities, rates, FX, credit, commodities, real-time news, secure chat (B-PIPE/IB), and execution management systems, all packaged for a human operator sitting in front of a screen.
As quantitative strategies matured, firms began attempting to bridge this human-centric tool to automated systems using the Bloomberg Desktop API (BLPAPI). While BLPAPI successfully handles modest, ad-hoc data extractions via Excel or Python scripts, it hits structural limits when subjected to high-throughput quantitative pipelines.
[Legacy Human-Centric Model]
Bloomberg Terminal ---> BLPAPI (Desktop) ---> Quota Limits / Operational Bottlenecks ---> Human Screen / Excel

[Modern Quantitative Pipeline]
FlashAlpha API ---> REST / WebSockets / MCP ---> Automated Model / Quantitative Backtester ---> Production Execution
The friction lies in the granularity of options data. A single day of per-strike analytics across the US options market touches far more than 5,000 unique contracts. Because each strike and expiration date operates as its own discrete identifier, a single liquid underlying asset can easily sustain several thousand live contracts across its chain. Running a cross-sectional study across a few hundred names does not merely graze a monthly request limit—it exhausts it entirely within a single afternoon.
The Quota Problem: An Operational Blindspot
The primary operational hurdle for quantitative researchers utilizing terminal APIs is the opacity of usage limits. Bloomberg does not publicly disclose exact programmatic quotas, nor does it provide a programmatic endpoint or header to check remaining capacity.
While the system is not silent—returning explicit error codes such as #N/A Limit (concurrent subscriptions), #N/A Daily Capacity (daily cap), and #N/A Mth Lmt (monthly cap)—developers can only discover these ceilings by hitting them. Consequently, large-scale historical backfills cannot be budgeted or planned effectively. A backtest or data pull runs until it abruptly fails mid-job. Worse still, a research script that executes successfully in March might fail in April simply because a colleague on the same enterprise license consumed the shared allowance first.
This is not a data quality defect; it is an operational misalignment. No internal budget reallocation can resolve this bottleneck while the access model remains tied to per-seat restrictions.
Supporting Context & Metrics: Terminal vs. API Architecture
To understand how traditional terminals and specialized analytics layers complement—rather than directly replace—one another, a direct side-by-side comparison of capabilities, access vectors, and economic profiles is necessary.
Comprehensive Capability Matrix
| Feature / Metric | Bloomberg Terminal | FlashAlpha |
|---|---|---|
| Primary Consumer | A human reader interacting with a screen | An automated model consuming an API |
| Asset Class Breadth | Comprehensive: Equities, Rates, FX, Credit, Commodities, News, Chat, Execution | US Equity, ETF, Index Options, and CME Futures Options only |
| Core Options Analytics | Per-contract Greeks, Volatility Surfaces, Pricers (OMON, OVDV, OVME) |
Aggregated Dealer Positioning: GEX, DEX, VEX, CHEX, Gamma Flip, Call/Put Wall, Max Pain, Regime |
| Programmatic Access | BLPAPI bundled with seat (quota-metered); firm-scale requires separate B-PIPE or Data License | REST, commercial WebSocket streaming, MCP server; SDKs for Python, JS, C#, Go, Java |
| Usage Limit Visibility | Undisclosed by vendor; no programmatic check available | Explicitly published per-tier limits returned in response headers |
| Point-in-Time Replay | Historical prices available; derived analytics layer cannot be replayed point-in-time | 51 analytics routes replayable at any minute within the symbol’s coverage window (dating back to 2017) |
| Permanent Self-Serve Free Tier | None (Trials and demos are sales-led) | Yes (5 requests/day, no credit card required, no expiration) |
Pricing and Economic Models
Note: Bloomberg does not publicly publish terminal pricing. Figures are derived from industry reports (such as NeuGroup data for 2026) and serve as reference baselines.
- Bloomberg Terminal: Single-seat pricing hovers around $31,980 per year (~$2,665/month), dropping slightly to $28,320 per seat/year for multi-seat deployments, typically bound by a mandatory two-year minimum commitment billed quarterly in advance. Enterprise-grade access via B-PIPE or Data Licenses requires separate commercial negotiation.
- FlashAlpha: Offers a self-serve tier scaling up to $1,499/month (or $1,199/month billed annually), with Professional nodes starting from $2,500/month and dedicated enterprise nodes scaling upward. Streaming WebSocket access starts at $4,500/month.
Official Perspectives and Data Computation Strategies
Bloomberg’s Strengths: The Reference Standard for Discretionary Workflows
Bloomberg’s options suite (OMON for option monitors, OVDV for volatility surfaces, and OVME for multi-leg structuring) is robust, highly trusted, and serves as an unmatched institutional reference standard. However, these tools are designed to answer questions for a human trader: What is the implied volatility of this specific contract? How does this multi-leg spread price right now?
Crucially, Bloomberg delivers raw inputs—prices, Greeks, and volatility surfaces. It does not compute aggregate market positioning views natively. Generating metrics like net gamma exposure by strike under a standardized dealer-sign convention, identifying gamma flip levels, locating call and put walls, or classifying volatility regimes requires pulling raw chains and constructing custom internal pipelines, which quickly runs afoul of desktop API quotas.
FlashAlpha’s Approach: Deep, Single-Layer Derived Analytics
FlashAlpha approaches the market from the opposite direction. It computes a specific derived analytical layer and nothing else:
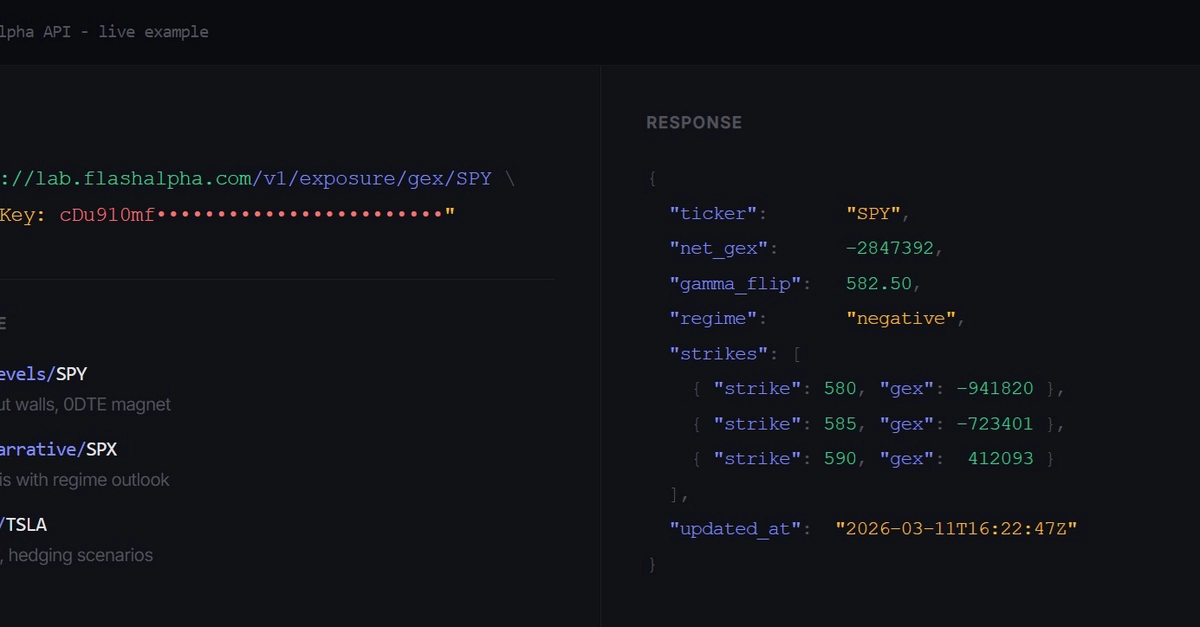
- Per-strike Exposures: GEX (Gamma Exposure), DEX (Delta Exposure), VEX (Vanna Exposure), and CHEX (Charm Exposure) utilizing explicit, documented dealer-sign conventions.
- Critical Levels: Gamma flip points, call and put walls, and max pain calculations.
- Surface Calibrations: SVI (Stochastic Volatility Inspired) calibrated surfaces complete with raw parameters and arbitrage violation flags.
- Regime & 0DTE Analytics: Volatility Risk Premium (VRP) metrics with z-scores, regime conditioning, and specialized zero-day-to-expiration analytics.
By returning aggregated insights in a single API call rather than forcing the client to process thousands of individual contracts, the architecture optimizes for machine consumption. Yet, this narrow focus is also its boundary: FlashAlpha contains no corporate fundamentals, macroeconomic news feeds, chat protocols, execution gateways, or non-US options coverage.
Future Outlook: The Hybrid Institutional Stack
The future of quantitative options research does not point toward consolidation into a single software vendor, but rather toward a modular "best-of-breed" stack.
[Institutional Quantitative Desk]
├── Bloomberg Terminal / B-PIPE  ---> Macro Data, News, Execution, Multi-Asset Pricing
└── FlashAlpha API / WebSocket   ---> High-Throughput Aggregated Dealer Positioning & Backtesting
The pragmatic realization across sophisticated trading desks is that both tools are necessary:
- The Terminal remains indispensable for macro context, news sentiment, cross-asset price history, execution management, and human-driven exploratory research.
- The Specialized Analytics API powers the systematic engine, enabling quantitative researchers to backtest positioning signals point-in-time (via endpoints utilizing parameters like
?at=), run high-frequency option chain scans, and feed machine learning models without fearing abrupt quota lockouts.
For quantitative funds seeking to test these capabilities against live screens, utilizing permanent free-tier REST endpoints allows developers to instantly verify per-strike data integrity against traditional terminal outputs (OMON), proving that modern research infrastructure thrives when specialized tools complement legacy giants rather than attempt to replace them.