
Executive Overview
In modern software engineering, monitoring systems are designed to offer peace of mind. Dashboards glow green, error counters rest at zero, and automated guards quietly patrol backend environments to catch silent regressions before they escalate into catastrophic production failures. Yet, an increasingly common architectural fallacy haunts even the most rigorous engineering teams: the assumption that the absence of noise equates to the presence of health.
Recently, a revealing incident within an advanced token and cost-tracking pipeline exposed a profound operational blind spot. The development team relied on an automated "anchor-drift detector"—a specialized guard designed to monitor whether a tokenization provider silently alters its underlying behavior behind an unchanged base URL. If left unchecked, such silent shifts cause cost projections to rely on legacy pricing metrics while actual prompt tokens drift invisibly, skewing financial models and resource allocation.
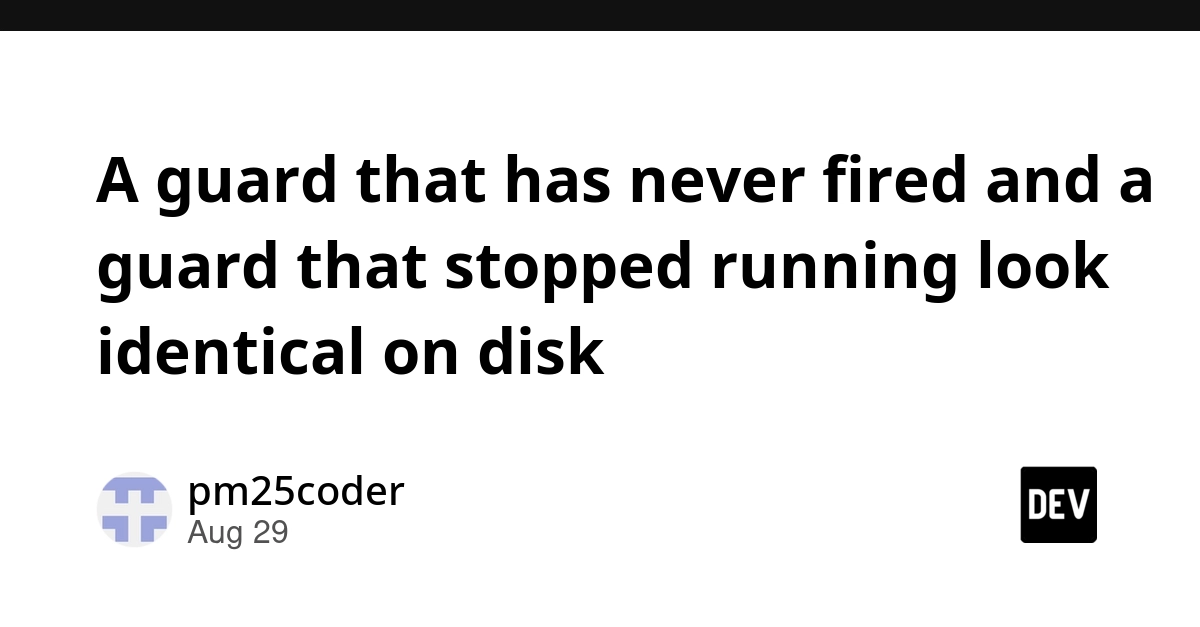
For weeks, the detector’s counter sat at zero. The threshold was set at 25%, and the alarm had never fired. The engineering team interpreted this pristine record as proof of system stability. In reality, it was a structural illusion. As a perceptive reader astutely pointed out during a postmortem analysis: “A guard that has never fired and a guard that stopped running look identical on disk.”
This article investigates how an offhand community observation catalyzed a 52-minute infrastructure overhaul, transforming a binary alert system into a continuous telemetry stream. By dissecting the anatomy of this fix, we explore the broader implications for software reliability, the psychology of observability, and why modern systems must be engineered to emit data during periods of absolute calm.
Detailed Chronology: From Blind Spot to 52-Minute Fix
The story of the anchor-drift detector began long before the recent fix. The system’s architects had already learned foundational lessons regarding data validation lower down the stack. Specifically, the anchor_loss event stream routinely proved that the write path was alive. Generating 45 discrete events per operational cycle, it demonstrated clearly that the writer ran successfully, files remained reachable, and data paths were fully operational.
Because of this lower-level precedent, the engineering team made a subtle, dangerous cognitive leap: they assumed that "hasn’t fired" was a rigorous measurement rather than an unverified assumption.
However, the anchor-drift detector was fundamentally flawed by design. Every time an anchored round executed, the system computed the bias shift, evaluated it against the 25% threshold, and promptly threw the number away if the shift was small. Sub-threshold spread—the granular data needed to answer critical questions like "Is normal drift typically 5% or 20%?"—was entirely invisible. The architecture owned zero data about the guard’s day-to-day existence, save for the single scenario where it crossed the threshold and chose to sound the alarm.
The Turning Point
The paradigm shifted when a reader responded to a published drift postmortem with an observation so obvious in hindsight that it immediately restructured the team’s perspective:
"You compute the shift on every round already. You just throw it away when it’s small. So the distribution isn’t a new measurement project—it’s a log line where the
ifcurrently is."
The realization was immediate. The data was already being calculated; it was simply being discarded at a conditional gate. No complex architectural redesign or distributed data pipeline was required to capture the distribution curve.
The Execution Loop
Operating on the project’s established ethos—where a community comment naming a real boundary immediately becomes an issue, and the evolutionary loop treats issues as binding orders—the development cycle commenced:
- Issue Identification to Merge: Exactly 52 minutes elapsed from the moment the community feedback was parsed as an issue to the final merged pull request.
- Prior Iteration Benchmark: For context, the very first loop of this specific project took 50 minutes. Nothing in the toolchain had been artificially optimized between the two events; the pipeline simply mirrored the natural rhythm of the development philosophy.
- The Core Implementation: The detector was refactored to log every computed shift unconditionally. The resulting heartbeat line now systematically records the
bias_shift, the staticthreshold, the old and new bias values, and a boolean flag indicating whether the drift actually breached the limit.
By separating data collection from alerting, the threshold no longer served as a gatekeeper for information; it became solely responsible for triggering alerts. Within a few hundred operational rounds, the elusive question of whether normal spread hovered at 5% or 20% transformed from an arbitrary configuration number into an empirical, measurable histogram.
Supporting Context & Metrics: The Anatomy of Observability Debt
To fully understand the weight of this fix, one must examine the metrics of observability debt—the hidden tax paid when monitoring systems fail to differentiate between silence due to health and silence due to death.

The Binary Trap of Traditional Thresholds
Most monitoring systems rely on threshold-based alerting. A metric is sampled, compared against a predefined limit ($x > textthreshold$), and if the condition is met, an alarm propagates through channels like PagerDuty or Slack. If the condition is not met, the system remains silent.
[ Incoming Token Data ]
         │
         ▼
[ Compute Bias Shift ] ──(Discarded if < 25%)──► [ Black Hole / No Telemetry ]
         │
         ▼ (Only if >= 25%)
[ Trigger Alert / Scream ]
This binary model introduces three critical failure modes:
- The Stale Configuration Risk: Thresholds chosen during initial deployment (such as a 25% drift allowance) often lack empirical backing. Without sub-threshold distribution data, engineers have no basis to defend, raise, or lower these limits.
- The Silent Failure Mode: If a monitoring daemon silently crashes, hangs, or fails to execute its polling loop, disk footprints and primary log files may remain completely unchanged. Without heartbeat telemetry confirming ongoing execution, operators operate under a false sense of security.
- Loss of Predictive Intelligence: By discarding sub-threshold data, teams blind themselves to gradual, systemic degradation. A slow creep from 2% drift to 22% drift remains entirely hidden until the final 3% pushes it over the edge, turning what could have been a predictable maintenance window into an emergency incident.
The Shift to Unconditional Telemetry
By modifying the architecture to log unconditionally, the telemetry pipeline underwent a fundamental transformation:
[ Incoming Token Data ]
         │
         ▼
[ Compute Bias Shift ] ──► [ Unconditional Log / Heartbeat ]
                                  │
                                  ├─► Records: bias_shift, threshold, old/new bias
                                  │
                                  ▼
                         [ Threshold Check (25%) ]
                                  │
                        ┌─────────┴─────────┐
                        ▼                   ▼
                     ( < 25% )           ( >= 25% )
                        │                   │
                        ▼                   ▼
                [ Quiet / Normal ]   [ Alert Triggered ]
In this revised model, a dead detector and a quiet detector no longer produce identical byte streams on disk. A dead detector stops generating heartbeat entries entirely, allowing automated watchdogs to flag missing telemetry immediately. A quiet detector, meanwhile, continuously feeds a rich stream of baseline data into the analytics pipeline.
Unit-Level Verification
To ensure regression resistance, the engineering team implemented comprehensive unit tests asserting the heartbeat output in both operational states:
- No-Drift State: Validates that normal, sub-threshold shifts correctly emit structured log lines containing all contextual metrics without invoking alert handlers.
- Drift State: Validates that boundary-breaching shifts correctly emit the identical heartbeat structure while simultaneously setting the escalation flag and triggering downstream alerts.
While a complete, scheduled synthetic provider swap—designed to periodically inject test-level drift through production doors—is slated for a future release, the current implementation successfully bridges the gap between raw data collection and verifiable test coverage.
Official Statements & Engineering Philosophy
Reflecting on the 52-minute turnaround, the lead engineers and core contributors emphasized that the speed of the fix was less about individual typing velocity and more about the structural health of the project’s feedback loop.
"The second loop wasn’t faster because we rushed; it was the exact same loop, serving as one more empirical data point that this project’s feedback path actually works," noted lead architect and contributor
pm25coder. "When your architecture invites external critique and treats community insights as direct orders, your mean-time-to-resolution naturally collapses. The most important guard in any system isn’t the code monitoring the tokens—it’s the feedback loop monitoring the codebases themselves."
Industry observers tracking the evolution of modern developer tooling have increasingly highlighted this exact dynamic. Traditional enterprise software development often suffers from bureaucratic latency, where valid architectural critiques must wind through multi-week ticketing systems, design reviews, and prioritization meetings.
In contrast, hyper-lean, feedback-driven pipelines treat well-reasoned developer commentary as high-priority telemetry. By lowering the friction between problem identification and code deployment, teams can close architectural blind spots almost as fast as they are discovered.
Future Outlook: The Evolution of Proactive Observability
The successful overhaul of the anchor-drift detector marks a significant milestone, but it also highlights the next frontier for autonomous system reliability. As AI-driven tokenization, dynamic pricing models, and complex multi-provider LLM pipelines become standard infrastructure components, the demand for intelligent, self-auditing telemetry will only accelerate.
Key Milestones on the Horizon
- Synthetic Provider Swaps in Production: The engineering roadmap includes the full integration of scheduled, automated synthetic provider swaps. By periodically injecting controlled anomalies into non-critical paths, the system will continuously verify that its alerting mechanisms are not only capable of firing, but actually do fire under predetermined conditions.
- Dashboard Integration for Guard Vital Signs: Future dashboard iterations will transition from displaying static status lights to featuring dedicated timelines tracking the "last planted fire" and "last real fire" dates. This separation ensures operators can distinguish between a system that is genuinely healthy and one that simply hasn’t been tested.
- Automated Drift Baseline Adjustments: With historical histograms of sub-threshold drift now safely captured in unconditional logs, future iterations of the pipeline will leverage machine learning models to dynamically adjust threshold limits based on shifting seasonal and operational baselines, eliminating the need for hardcoded friction points.
Conclusion
The lesson of the silent guard serves as an enduring reminder for software engineers across every discipline: never trust a zero that has not been earned.
By ensuring that normal, uneventful operations leave as distinct an electronic footprint as critical emergencies, engineering teams can eliminate ambiguity, restore trust in their monitoring dashboards, and build resilient systems capable of surviving the silent failures that traditional metrics miss.