

Executive Overview
In an extraordinary demonstration of brand resilience and unmatched consumer loyalty, Apple has officially posted its highest-ever global smartphone revenue for a third calendar quarter. According to a comprehensive market intelligence report released by Counterpoint Research, the Cupertino-based tech giant continues to defy broader economic headwinds, successfully capturing a record-breaking slice of the worldwide mobile market. Despite a generally sluggish macro environment marked by fluctuating component costs and shifting consumer spending habits, Apple’s ability to command high profit margins highlights a widening chasm between it and its competitors.
The data reveals that Apple achieved an unprecedented Average Selling Price (ASP) of $1,031 per iPhone during the quarter—a staggering 19% increase year-over-year. This monumental leap was primarily catalyzed by the strategic rollout of the iPhone 18 Pro series, shrewd pricing adjustments across legacy models, and a deliberate recalibration of the standard smartphone lineup. While perennial rival Samsung narrowly maintained its traditional crown in total unit shipments with 22% of the global share—closely trailed by Apple at 21%—Apple’s financial dominance remains uncontested. Capturing the lion’s share of industry revenues, Apple proves that in the modern smartphone arena, premium positioning and pricing power far outweigh raw volume.
Detailed Chronology of the Q3 Market Dynamics
The third quarter of any calendar year is traditionally a high-stakes crucible for the mobile industry, characterized by the frantic ramp-up of manufacturing lines and late-summer media events. For Q3 2026, the timeline of market events played out in a way that uniquely favored Apple’s long-term financial strategy.
Early July to August: The Quiet Before the Storm
As the industry moved through mid-summer, market analysts anticipated a modest third quarter. Global supply chains were grappling with rising input costs, particularly concerning surging memory chip pricing. While many original equipment manufacturers (OEMs) worried about absorbing these expenses or passing them on to cost-sensitive consumers—risking immediate drops in demand—Apple was quietly positioning its supply chain to weather the storm. Rumors surrounding the upcoming hardware cycle had already begun to shape consumer purchasing habits, leading to a natural stabilization period for older device sales.
September: The Strategic Launch Window
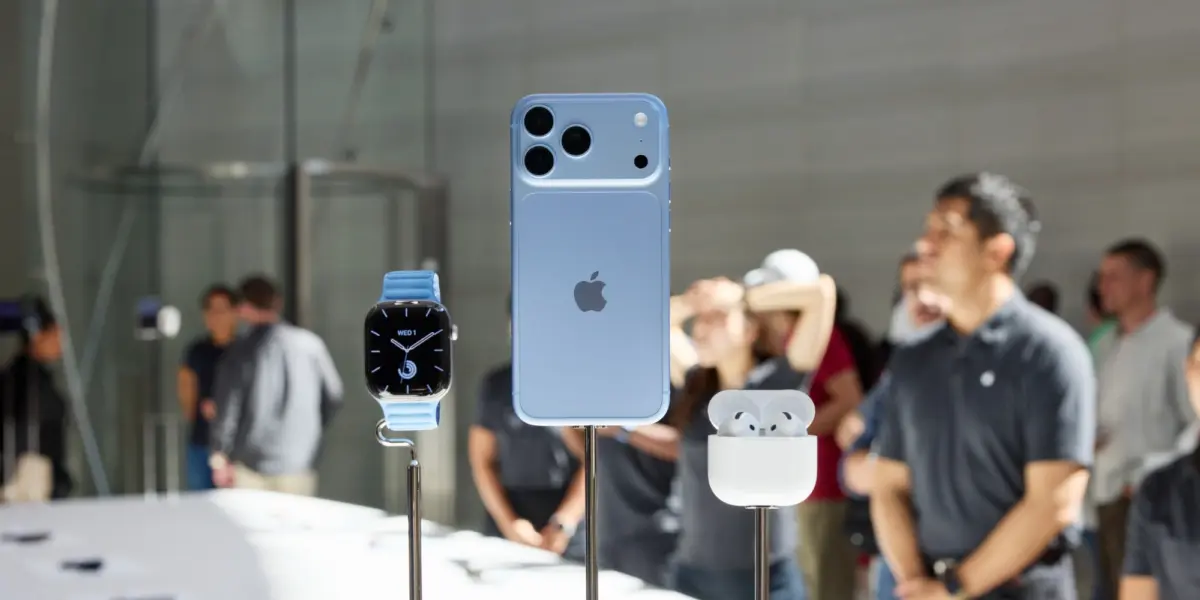
The pivotal moment of the quarter arrived in September with Apple’s highly anticipated hardware reveal. Breaking from past traditions, the company executed a calculated product staging strategy. Rather than rolling out a standard baseline model alongside the premium tier, Apple held back the baseline iPhone 18, choosing instead to lead exclusively with the high-end iPhone 18 Pro and Pro Max series, while simultaneously implementing calculated price bumps across its older generation of devices still active on retail shelves.

Even though the iPhone 18 Pro series hit shelves toward the very tail end of the third calendar quarter, its immediate commercial impact was instantaneous and profound. The devices did not merely meet sales expectations; they redefined the upper ceiling of what consumers are willing to pay for pocket-sized computing power.
Supporting Context & Metrics: Breaking Down the Numbers
To fully grasp the magnitude of Apple’s Q3 2026 performance, one must examine the broader macroeconomic metrics provided by Counterpoint Research. The global smartphone market has experienced years of cautious recovery, marked by consumers holding onto their devices for longer periods. Yet, revenue figures continue to decouple from pure shipment volumes.
The Global Revenue Landscape
According to the Counterpoint report, global smartphone revenue actually managed a 3% year-over-year increase, defying what many feared would be a severe shipment slump. However, the spoils of this growth were distributed unevenly across the ecosystem.
- Apple: Claimed the undisputed top spot in global smartphone revenue, securing its highest-ever Q3 share in corporate history.
- Samsung: Secured second place in global revenue, accounting for 19% of the worldwide total. Despite moving more total units, Samsung’s heavy reliance on mid-range and budget Galaxy A-series devices keeps its overall average selling price significantly lower than Apple’s.
- Xiaomi: Captured 6% of global revenue, maintaining a steady foothold primarily driven by aggressive expansion in emerging international markets and competitive online sales strategies.
- OPPO: Followed closely behind with 5% of the global revenue share.
- vivo: Rounded out the top five manufacturers, accounting for 4% of worldwide industry revenues.
The $1,031 Milestone: A New Normal for iPhone Pricing
Perhaps the most eye-opening metric in the entire report is Apple’s Average Selling Price (ASP) hitting $1,031, representing a massive 19% year-over-year surge. For years, industry critics warned that smartphones had hit a "ceiling" around the $800 to $900 mark, suggesting that consumer resistance would inevitably cap further price inflation. Apple’s Q3 metrics decisively shatter this narrative. By convincing millions of global consumers that the iPhone is an indispensable, long-term investment—coupled with integrated AI capabilities and premium build qualities—Apple has successfully normalized four-figure baseline expectations for flagship mobile hardware.
Official Statements and Industry Analysis
The implications of these numbers extend far beyond Apple’s quarterly balance sheet; they offer a masterclass in modern corporate economics and supply chain management. Tarun Pathak, Research Director at Counterpoint Research, provided deep context regarding how Apple managed to maneuver through a notoriously tricky economic climate:

"Apple remained the most resilient major brand in Q3 2026, with shipments nearly flat YoY. Apple has the pricing power to absorb rising memory costs and pass them on to consumers with minimal impact on demand. At the same time, ASP growth was supported by higher launch prices for the iPhone 18 Pro series, the absence of the base iPhone 18 from the launch and price increases across older models in September. Together, these factors helped Apple deliver strong revenue growth in an otherwise challenging market."
Pathak’s analysis underscores a fundamental competitive advantage that Apple holds over its Android-based counterparts: pricing power. While competitors operate in highly commoditized markets where a $20 price difference can sway a buyer, Apple operates within a fortified ecosystem. Consumers heavily invested in iCloud, Apple Watch, AirPods, and macOS integration view the iPhone not as a standalone gadget, but as the indispensable anchor of their digital lives. Consequently, when memory component costs spike or new manufacturing technologies drive up production overhead, Apple can seamlessly pass those costs along to its consumer base without triggering user churn.
Furthermore, the strategic decision to stagger the release schedule—withholding the baseline iPhone 18 while showcasing the Pro models—forced fence-sitting buyers to either invest in the premium tier or purchase marked-up legacy models like the iPhone 17 series. Both pathways dramatically elevated the overall yield per device sold.
Future Outlook: What This Means for the Smartphone Industry
As the mobile industry looks beyond the close of 2026 and heads into the new year, Counterpoint’s Q3 data serves as a critical bellwether for where the market is heading.
1. The Death of the Race to the Bottom
For over a decade, many analysts predicted that the future of mobile telephony lay in hyper-affordable devices destined for emerging markets. While volume shipments remain heavily concentrated in the budget and mid-tier segments—as evidenced by Samsung’s narrow victory in total unit shipments (22% to Apple’s 21%)—the true financial lifeblood of the industry has migrated decisively upscale. Competitors attempting to copy Apple’s margin playbook will find it difficult without an equivalent ecosystem lock-in, forcing Android manufacturers to either accept razor-thin margins on high-volume shipments or invest heavily in proprietary software and hardware integration.

2. The Resilience of Premium Upgrades
Consumers are no longer upgrading their phones every 12 to 24 months. The replacement cycle has lengthened significantly across the board, stretching past three years in many developed markets. However, Counterpoint’s data proves that when consumers do finally decide to replace an aging device, they are increasingly opting for top-tier, future-proofed hardware rather than budget compromises. The willingness to pay upwards of $1,000 for a smartphone indicates that mobile devices have achieved an irreplaceable status in daily life, superseding traditional desktop computers and standalone cameras in consumer priority budgets.
3. Apple’s Unrivaled Market Position Heading into Q4
With the holiday shopping season fast approaching—traditionally Apple’s most lucrative period of the fiscal year—the momentum captured in Q3 places the company in an enviable strategic posture. The delayed rollout of the broader iPhone 18 family guarantees sustained media attention and staggered inventory rushes as the holiday quarter unfolds.
Ultimately, Counterpoint Research’s Q3 2026 report paints a vivid picture of a maturing technology market where raw unit growth is no longer the sole metric of success. By mastering the delicate balance between premium hardware innovation, aggressive pricing architecture, and unwavering brand loyalty, Apple has not only survived a challenging global economic climate—it has rewritten the rules of profitability for the entire consumer electronics industry.