
Executive Overview
In the modern architecture of artificial intelligence and automated software deployment, system reliability is rarely compromised by catastrophic, highly visible failures. Instead, organizations increasingly find themselves vulnerable to subtle, insidious misconfigurations where individual components operate nominally while the overall system fails entirely. This phenomenon—often referred to as a "phantom outage"—presents a unique challenge to engineering teams, as traditional monitoring systems, log analyzers, and alerting mechanisms frequently fail to detect the anomaly.
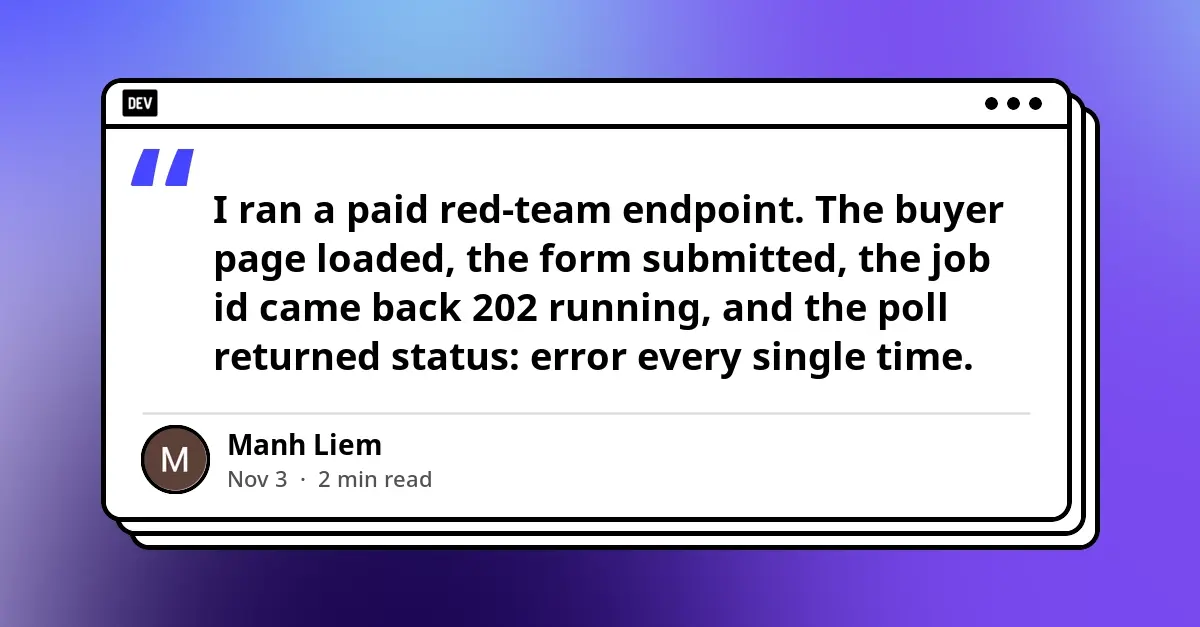
A striking case of this vulnerability recently came to light when an engineer experienced a frustrating paradox: a paid artificial intelligence red-team endpoint appeared to accept jobs seamlessly, yet every single submission terminated in a mysterious, persistent error. The user-facing buyer page loaded correctly, form submissions were accepted, job IDs were successfully generated with a 202 Running status, and yet polling loops invariably returned an error state: model endpoint unreachable at http://127.0.0.1:10100/v1.
However, the underlying generative model was not unreachable. The infrastructure hosting the model was fully operational, responsive, and capable of processing inputs. The root cause of the failure was neither network degradation nor hardware failure, but rather a classic logical fallacy in software engineering: the system’s automated health check was asking the wrong question.
This investigative report examines the mechanics of this failure, exploring how an expired third-party authentication token cascaded into a complete service blackout through the flawed implementation of a liveness probe. Furthermore, this article explores why such composite failures are exponentially more dangerous than hard outages, details the diagnostic steps required to uncover the truth, and outlines the architectural paradigms necessary to prevent similar silent failures in high-availability AI systems.
Detailed Chronology: Anatomy of a Silent Failure
To understand how a functioning AI model became entirely inaccessible to paying customers, one must trace the exact sequence of operations executed by the platform’s backend workers upon receiving a task. The incident unfolded through a precise, albeit flawed, chain of automated logic that prioritizes metadata verification over operational capability.
Phase 1: The Illusion of Functionality
The incident began when the author elected to run a paid red-team endpoint designed to evaluate the safety and robustness of an AI model. The user-facing experience was entirely unremarkable in its smoothness. The buyer portal loaded within standard latency parameters, the configuration form accepted inputs without validation errors, and clicking the submission button yielded an immediate positive response.
The backend acknowledged the request by returning a valid job ID accompanied by an HTTP 202 Accepted status code, indicating that the task had been successfully queued for execution. For any end-user, this represents the standard, expected handshake of a healthy, asynchronous cloud service.
Yet, when the client began polling the job status endpoint to retrieve the results of the red-team evaluation, the system systematically betrayed its internal integrity. Every poll returned an identical, unyielding status message: error. The accompanying diagnostic payload pointed directly to the local model proxy: model endpoint unreachable at http://127.0.0.1:10100/v1.
Phase 2: The Flawed Liveness Check
Driven by the discrepancy between a successful job submission and a persistent "unreachable" error, an investigation into the worker node’s execution logic was initiated. It quickly became apparent that the system was pre-programmed to execute a preliminary diagnostic before processing any user-submitted red-team payloads.
Before running a single probe or allocating resources to the evaluation task, the worker executed an automated liveness check via an HTTP GET request to /v1/models. In an ideal architecture, this route should query the active status of the model registry. However, in this specific implementation, the /v1/models route belonged to a local model proxy whose sole responsibility was to serve a comprehensive hosted provider roster.
Building and maintaining this roster required an active, valid refresh token capable of authenticating against a third-party identity provider account. Unbeknownst to the system administrators, this critical refresh token had recently expired. Consequently, whenever the liveness check queried the /v1/models route, the third-party authentication failure forced the endpoint to respond with an HTTP 500 Internal Server Error.
The fatal flaw lay not in the expired token itself, but in the brittle logic of the worker’s gatekeeper function. The liveness check was explicitly programmed to treat any non-200 OK HTTP status code from the /v1/models route as definitive proof that the underlying model was unreachable. Upon encountering the 500 Internal Server Error, the worker immediately aborted its execution thread, returning an error state to the polling mechanism before attempting to execute a single probe.
Phase 3: The Functional Inference Path
The absurdity of the situation was compounded by the fact that the actual inference engine was in a pristine state of health. The critical route responsible for executing model evaluations was not /v1/models, but rather POST /v1/chat/completions.
This functional inference route was managed and served directly by a dedicated provider router—a completely separate component from the metadata roster that suffered from the expired token. While the metadata endpoint was throwing 500 errors, the provider router was fully operational, authenticated, and ready to process requests.
To confirm this hypothesis, a manual diagnostic request was dispatched directly to the inference endpoint: POST /v1/chat/completions configured with max_tokens: 1. The system responded instantly with an HTTP 200 OK status code, accompanied by a fully formed, valid completion body.
The system possessed a completely functional inference path, a completely broken metadata management path, and a rigid, unyielding gatekeeper that exclusively checked the metadata path. Every single job submitted by users was being ruthlessly intercepted and discarded at the gate, entirely unaware that the path to actual model execution was wide open.
Supporting Context & Metrics: Why This Is Worse Than a Hard Outage
In the taxonomy of system reliability engineering, hardware crashes, network partitions, and database corruptions are classified as "hard outages." While disruptive, hard outages possess a distinct redeeming quality: they are aggressively visible.
A hard outage screams for attention. Application performance monitoring (APM) tools trigger flashing red alerts, error rates spike exponentially on observability dashboards, HTTP 5xx error responses flood server access logs, and automated alerting systems bombard on-call engineers via PagerDuty or Slack. Because the failure is loud, the Mean Time to Detection (MTTD) is typically measured in minutes.
A phantom outage, conversely, operates in complete stealth. It is a silent assassin of user trust and operational revenue.
+---------------------------------------------------------------------------------+
|                         THE PHANTOM OUTAGE ARCHITECTURE                         |
+---------------------------------------------------------------------------------+

  [ User Browser ] ---> ( Loads Buyer Page: HTTP 200 ) ---> Success
  [ User Browser ] ---> ( Submits Form: HTTP 202 Running ) -> Success
  [ Polling Loop ] ---> ( Checks Job Status: Returns Error ) -> "Model Unreachable"

  -------------------------------------------------------------------------------
  UNDERLYING REALITY:
  - Liveness Check: GET /v1/models  ---> Fails (Expired Token -> HTTP 500)
  - Inference Path: POST /v1/completions -> Healthy (Active -> HTTP 200)
  -------------------------------------------------------------------------------
  RESULT: Every individual response is technically accurate;
          the system composition is entirely broken. Zero log anomalies.
+---------------------------------------------------------------------------------+
The Anatomy of a Stealthy Failure
Consider the metrics and telemetry generated during this specific incident:
- The Buyer Page: Returned HTTP
200 OK. (Factually true; the static assets and frontend application rendered perfectly.) - The Submit Endpoint: Returned HTTP
202 Accepted(Running). (Factually true; the API gateway successfully received the payload and generated a tracking ID.) - The Job Status Poll: Returned
status: error. (Factually true; the execution worker failed to complete the task because it aborted at the liveness gate.) - The Liveness Check: Returned HTTP
500 Internal Server Error. (Factually true; the metadata roster proxy failed to authenticate against the third-party provider.)
Every single individual component response, log entry, and metric data point was strictly accurate in isolation. Yet, their composition created a catastrophic systemic failure. Because no single subsystem experienced an unhandled exception, crash, or memory leak, no log anomalies were generated that could serve as a trigger for automated alert rules.
From the perspective of traditional log aggregators, the system was behaving exactly as written: it checked the model status, received an error from the roster, and reported that the model was unreachable. The fact that the model was actually reachable was entirely irrelevant to the flawed logic of the gatekeeper.
The Business Impact
The financial and reputational ramifications of phantom outages far exceed those of traditional downtime. When a website goes completely dark, users immediately know not to waste their time or money. They refresh, wait for resolution, or submit support tickets that alert the engineering team.
During a phantom outage, however, paying customers continue to interact with the platform under the false assumption that services are rendering correctly. Users configure complex red-team workloads, invest time in defining security parameters, submit paid jobs, and wait patiently for evaluations that will never arrive.
This erodes user confidence far more rapidly than a transparent outage. To the customer, the platform appears erratic, unreliable, and broken on a fundamental level. Furthermore, if the service operates on a pay-per-job or subscription model, billing systems may continue to register transactions or consume API credits for queued jobs that are doomed to fail before execution even begins.
Remediation and Prevention: Engineering Robustness
Resolving the immediate crisis required more than simply updating an expired authentication token. While refreshing the third-party credential would restore functionality temporarily, it would leave the underlying architectural vulnerability completely exposed to the next credential expiration, network glitch, or proxy failure.
True engineering resilience requires redesigning how systems validate their own operational readiness.
1. Fixing the Liveness Probe: Asking the Right Question
The primary systemic error was conflating metadata availability with inference capability. A liveness check must never rely on auxiliary, non-essential services unless those services are absolute prerequisites for core functionality.
To rectify the probe, the engineering team decoupled the model roster synchronization from the execution pipeline’s gatekeeper function. More importantly, they restructured the probe to directly target the exact operational dependency required by the workload.
As outlined in post-incident reviews, the correct methodology for probing an AI inference endpoint is startlingly simple: run the exact same call the product runs, scoped to the absolute smallest possible size that still validates the execution path.
# Conceptual implementation of a robust, minimal inference probe
import requests

def probe_inference_endpoint():
    payload =
        "model": "red-team-target-model",
        "messages": ["role": "user", "content": "ping"],
        "max_tokens": 1

    headers = "Authorization": "Bearer internal-service-token"

    try:
        response = requests.post(
            "http://127.0.0.1:10100/v1/chat/completions",
            json=payload,
            headers=headers,
            timeout=5.0
        )
        # Verify that the inference router can successfully generate a token
        if response.status_code == 200 and len(response.json().get("choices", [])) > 0:
            return True
        return False
    except requests.RequestException:
        return false
By executing a POST /v1/chat/completions request restricted to a single token (max_tokens: 1), the system achieves three critical objectives:
- Negligible Cost: A single token consumes virtually zero computational resources, negligible API credits, and minimal network bandwidth.
- Exact Route Verification: It exercises the exact HTTP route, proxy, provider router, and model weights that the product depends on for core functionality.
- Decoupling from Metadata: A metadata endpoint (such as a provider roster, billing ledger, or user profile database) can experience downtime, undergo renaming, become rate-limited, or suffer from expired tokens without impacting a single real request. Probing metadata tells an engineer about the health of administrative rosters, not about the health of the product.
2. Implementing the Second Gate: End-to-End Synthetic Monitoring
Fixing the initial liveness probe prevented future false negatives caused by broken metadata proxies, but sophisticated engineering teams recognize that component-level health checks are never entirely sufficient. Individual components can report a state of pristine health while the overarching execution chain remains completely fractured.
To achieve absolute observability, the engineering team implemented a secondary gate: continuous end-to-end synthetic monitoring.
+---------------------------------------------------------------------------------+
|                       END-TO-END SYNTHETIC MONITORING CHAIN                     |
+---------------------------------------------------------------------------------+

  [ Synthetic Worker (Every 2 Hours) ]
                 |
                 v
  1. Load Buyer Page (Simulated Browser / HTTP Client)
                 |
                 v
  2. Submit Red-Team Job Payload
                 |
                 v
  3. Verify Queue Enqueuing (Job ID Generated)
                 |
                 v
  4. Process via Worker & Model Call (POST /v1/chat/completions)
                 |
                 v
  5. Write & Validate Final Report Output
                 |
                 v
  [ SUCCESS: Status == 'Done' AND Report != Empty ] ---> ( All Systems Verified )
  [ FAILURE: Any Step Breaks ]                      ---> ( Immediate High-Priority Alert )
+---------------------------------------------------------------------------------+
This synthetic monitor operates on a strict schedule, executing a complete, real red-team job from end-to-end every two hours. The monitoring script is programmed to assert strict validation criteria upon completion: the job status must return explicitly as done, and the resulting output report must contain valid, non-empty text.
This architecture is the only methodology capable of covering the entire operational chain:
- Page serving infrastructure
- Form submission and API gateway routing
- Asynchronous task queuing systems
- Worker node processing threads
- Active model inference calls
- Database write operations and report generation
If any single component in this lengthy chain fails—even if all individual liveness checks report green—the end-to-end synthetic monitor will fail, triggering an immediate, high-priority alert to the engineering team.
3. Cost-Benefit Analysis of Synthetic Monitoring
In software architecture, every monitoring layer introduces operational overhead and computational cost. Evaluating the implementation of the two-hour synthetic monitoring cycle reveals a stark economic contrast:
- The Cost of Monitoring: Exactly one real AI inference job executed every two hours. Distributed across a 24-hour cycle, this equates to 12 minor API requests per day—representing negligible financial expense and compute utilization.
- The Cost of Inaction: A full day of production traffic directed to a user-facing buyer page where every single submission silently fails, resulting in frustrated enterprise customers, abandoned sessions, damaged brand reputation, and lost revenue.
When framed through this economic lens, end-to-end synthetic monitoring transforms from an optional development luxury into an essential enterprise safeguard.
Future Outlook: The Evolution of Observability in AI Systems
As artificial intelligence applications transition from experimental prototypes to mission-critical, enterprise-grade production systems, the complexity of underlying failure modes will continue to escalate. The traditional paradigms of software monitoring—reliant heavily on CPU utilization, memory thresholds, and basic HTTP status codes—are fundamentally ill-equipped to address the semantic complexities of generative AI infrastructure.
The Shift Toward Semantic Observability
Future observability platforms will move beyond simple infrastructure telemetry to embrace semantic observability. In an AI-driven ecosystem, a system is not "healthy" simply because a server is returning HTTP 200 OK. A system is healthy only when its outputs possess semantic validity, contextual relevance, and logical coherence.
Engineering teams building AI endpoints must adopt several forward-looking principles to protect against phantom outages:
- Zero-Trust Liveness Probes: Liveness and readiness probes must be subjected to the same rigorous architectural reviews as core business logic. Probes that rely on auxiliary metadata services must be deprecated in favor of functional, capability-based smoke tests.
- Synthetic User Journeys: Automated testing frameworks must simulate complete user interactions rather than isolated API calls. By continuously executing end-to-end synthetic transactions, organizations can bridge the dangerous gap between component-level health and system-level reality.
- Anomaly-Driven Alerting on Silent Failures: Because silent failures generate no traditional error logs, monitoring systems must incorporate behavioral analytics. A sudden, unexplained drop in successful job completions—coupled with a flatline in error logs—must be treated as an anomaly and routed immediately to on-call engineers.
Conclusion
The incident of the phantom red-team endpoint serves as a sobering reminder of the fragility inherent in complex software compositions. A single expired token in an obscure metadata roster should never be capable of holding an entire AI inference platform hostage.
By replacing brittle, indirect liveness checks with minimal functional probes and implementing robust end-to-end synthetic monitoring, engineering organizations can illuminate the shadows where phantom outages hide. In the era of autonomous AI systems, building software that works is no longer enough; systems must be explicitly designed to prove, without ambiguity, that they are working.