
The modern software landscape is undergoing a profound paradigm shift. As organizations rapidly scale microservices architectures and inject generative AI (genAI) capabilities—including complex, autonomous agentic workloads—into their core business processes, traditional observability tooling is buckling under the weight. Engineering teams are finding themselves trapped in a reactive cycle: maintaining brittle, static dashboards, continuously tuning false-positive thresholds, and frantically jumping between fragmented monitoring silos to piece together the narrative of a catastrophic system failure.
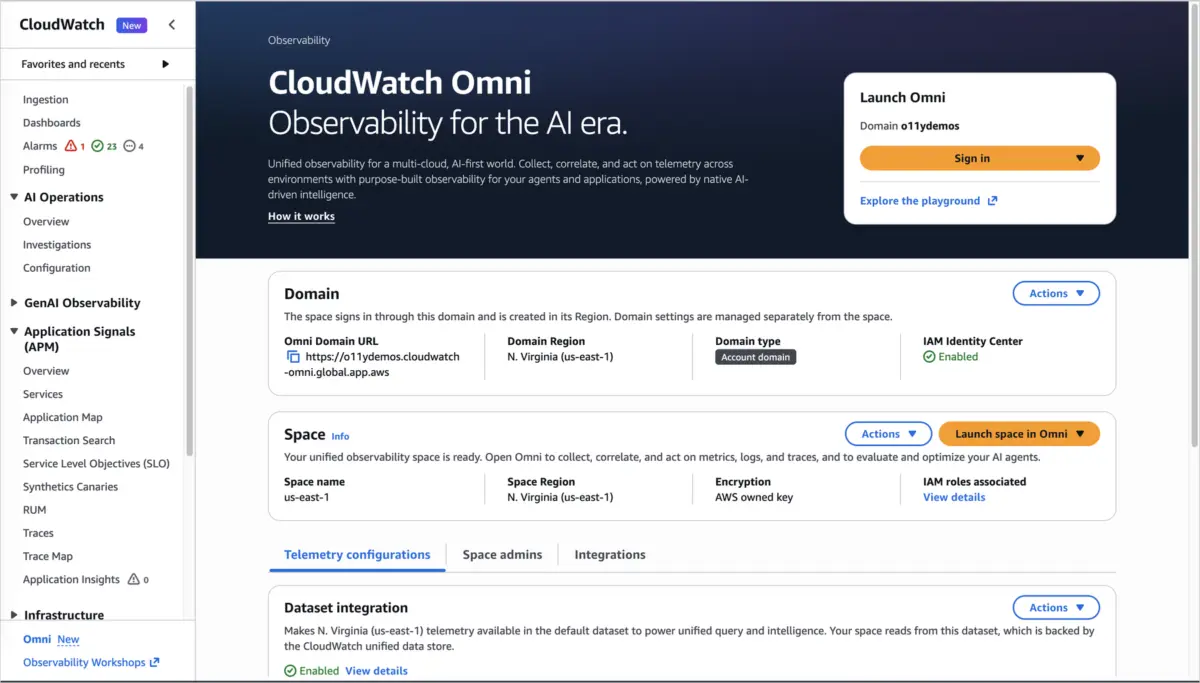
To combat this mounting operational complexity, Amazon Web Services (AWS) has officially announced the launch of Amazon CloudWatch Omni. Built natively on OpenTelemetry standards, CloudWatch Omni represents a generational leap forward, introducing an AI-powered observability experience that unifies application monitoring, multi-environment telemetry, and specialized generative AI agent tracking into a single, cohesive workspace.
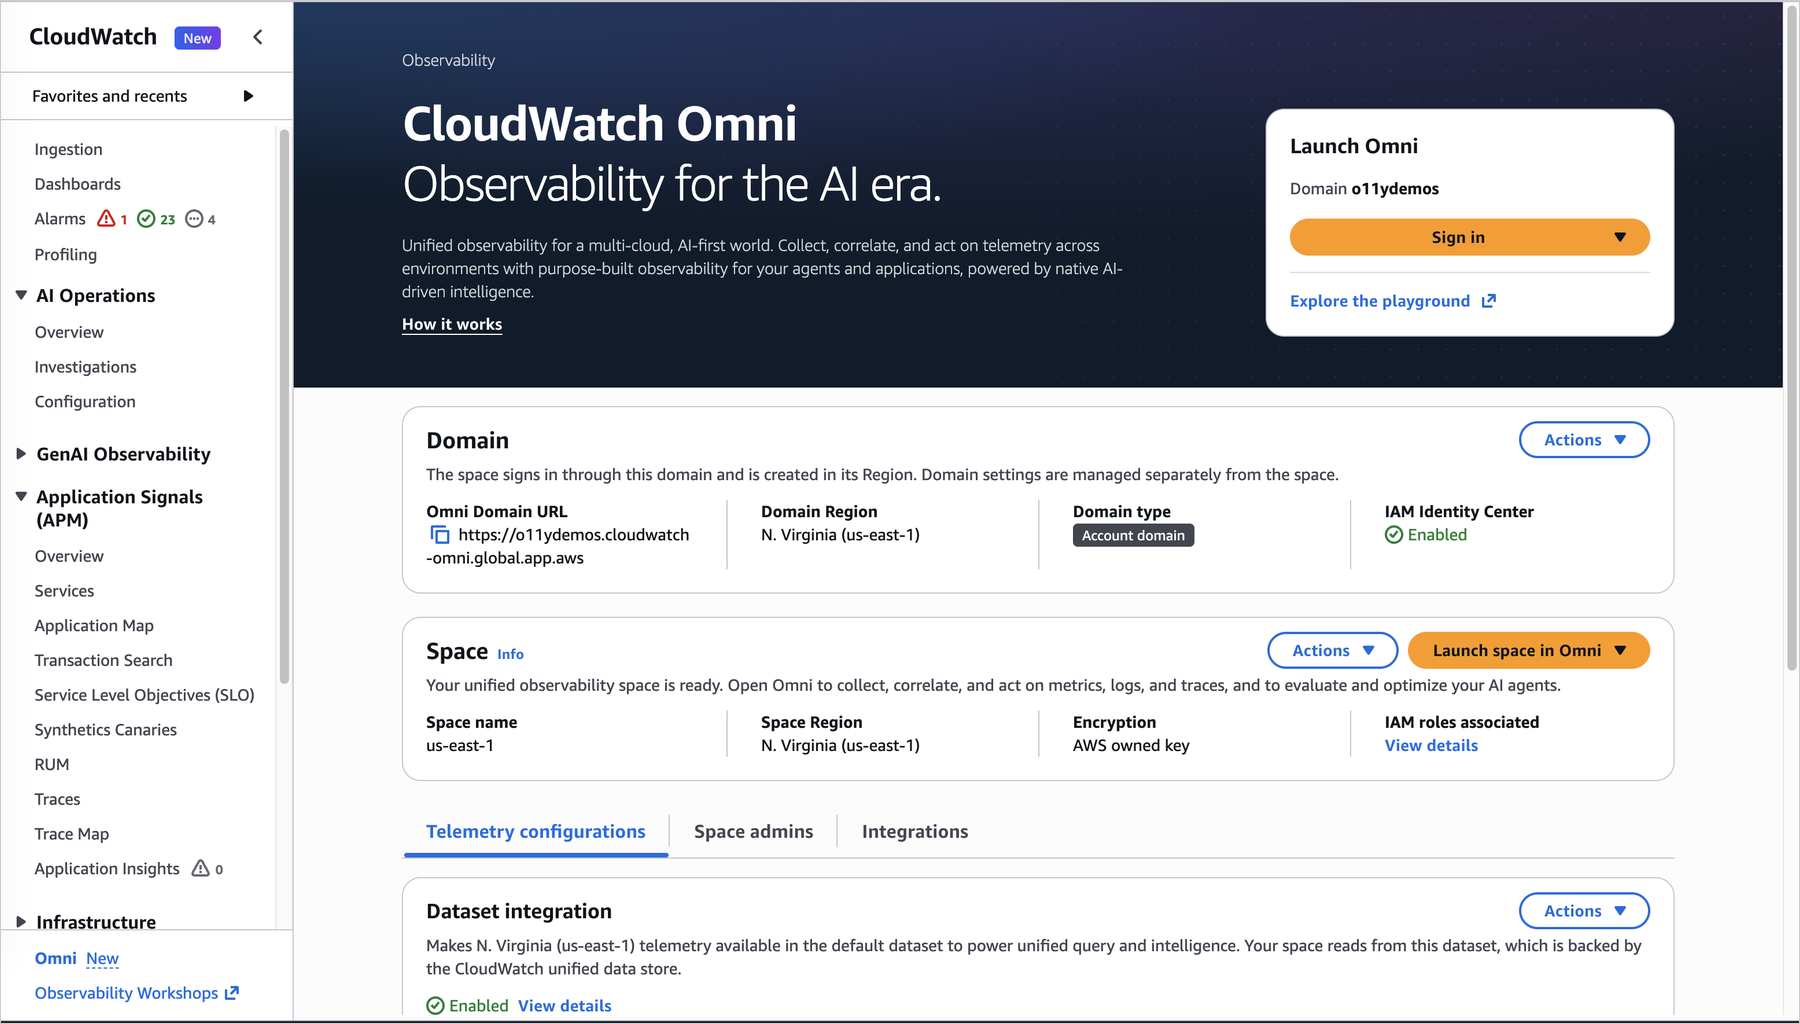
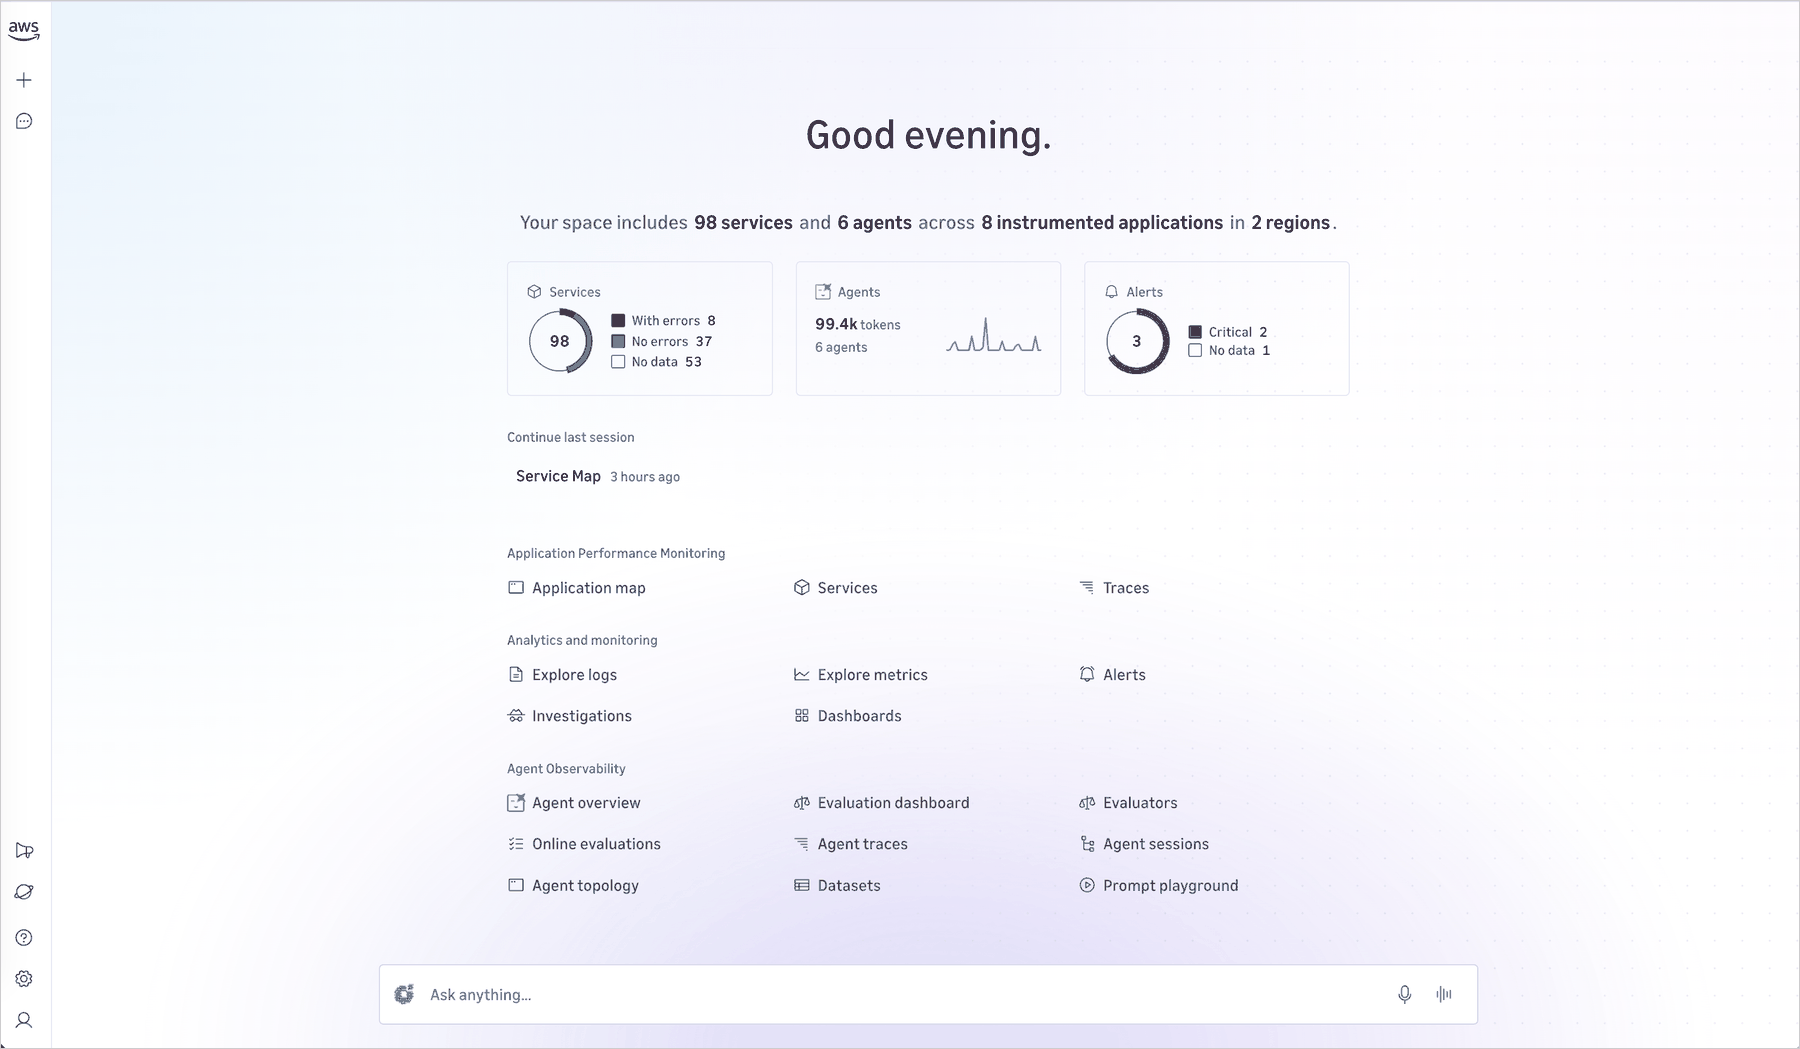
Unlike legacy observability platforms that isolate metrics, logs, and traces behind infrastructural components, CloudWatch Omni reorganizes the entire monitoring paradigm around the application itself. Powered by the intelligent orchestration of the Amazon DevOps Agent and accessible via dedicated organization-specific URLs utilizing enterprise single sign-on (SSO), Omni eliminates the traditional friction of AWS Management Console access. SREs, developers, database administrators, and engineering managers can now collaborate within the same live investigative context.
By automating dependency mapping, dynamically adjusting thresholds based on business targets, and offering natural language telemetry querying, CloudWatch Omni is poised to radically alter how enterprise engineering organizations diagnose, triage, and remediate complex distributed incidents.
Detailed Chronology: The Architectural Evolution Leading to CloudWatch Omni
The Fragmented State of Legacy Observability
For over a decade, application performance monitoring (APM) and infrastructure observability have followed a rigid, siloed trajectory. Engineers configured custom dashboards for EC2 instances, Kubernetes clusters, relational databases, and serverless functions independently. While this approach provided granular visibility into discrete components, it fundamentally failed to capture the holistic health of interconnected application ecosystems.
When a multi-tier transaction failed—such as a user checkout flow dropping packets between a front-end React application, a microservices-based pricing engine, and a third-party payment gateway—investigating the root cause required a grueling exercise in context-switching. Engineers would harvest log lines, correlate timestamps manually across separate tools, and post screenshots into chaotic Slack threads. Institutional knowledge became trapped in ephemeral chat histories, and cross-team escalations inevitably dragged on as new participants tried to catch up with incomplete information.
The Rise of OpenTelemetry and the AI Imperative
Recognizing the unsustainable trajectory of proprietary instrumentation agents, the cloud-native computing community rallied around OpenTelemetry (OTel) as the universal standard for capturing metrics, logs, and traces. AWS actively embraced this transition, laying the groundwork for a unified telemetry layer.
Concurrently, the rapid enterprise adoption of large language models (LLMs) and autonomous AI agents introduced an entirely new class of observability challenges. Agentic workflows—where AI systems autonomously plan, execute multi-step tasks, and call external APIs—exhibit non-deterministic behaviors that defy traditional metric tracking. Standard dashboards cannot capture the semantic drift, token latency, prompt degradation, or recursive loop failures inherent to generative applications.

AWS responded to this dual challenge through a strategic rollout. In a companion release, AWS introduced purpose-built agent observability capabilities tailored specifically for genAI workloads. Now, with the launch of CloudWatch Omni, AWS has unified these specialized agentic monitoring tools with an enterprise-grade application observability platform, creating a comprehensive solution built for the next generation of software engineering.
Supporting Context & Metrics: How CloudWatch Omni Transforms Incident Management
CloudWatch Omni addresses three foundational pain points historically reported by enterprise engineering leadership: fragmented team collaboration, the crushing maintenance burden of static dashboards, and the manual toil of root-cause isolation.
1. Unified Collaborative Spaces
CloudWatch Omni bridges organizational divides by introducing dedicated, enterprise-secured workspaces known as Spaces. Each Space aggregates the applications owned by a specific team alongside all associated telemetry data.
- Seamless SSO Integration: Team members authenticate via IAM Identity Center, supporting industry-standard identity providers such as Okta and Microsoft Entra ID (formerly Azure AD). Crucially, working within a Space does not require access to the AWS Management Console, democratizing telemetry data access for cross-functional stakeholders including product managers and database engineers.
- Preserved Investigation History: When an incident escalates from an on-call SRE to a specialized domain team (such as a database or payments group), the incoming engineer joins the exact same live session. Every prior hypothesis, correlated log, and automated agent finding is instantly visible, eliminating the "re-explain the problem" bottleneck.
2. Autonomous System Adaptation
Static dashboards require constant human intervention to remain relevant. If a development team deploys a new microservice or refactors an existing API endpoint, engineers must manually update dashboard widgets, redraw dependency lines, and re-tune alarm thresholds.
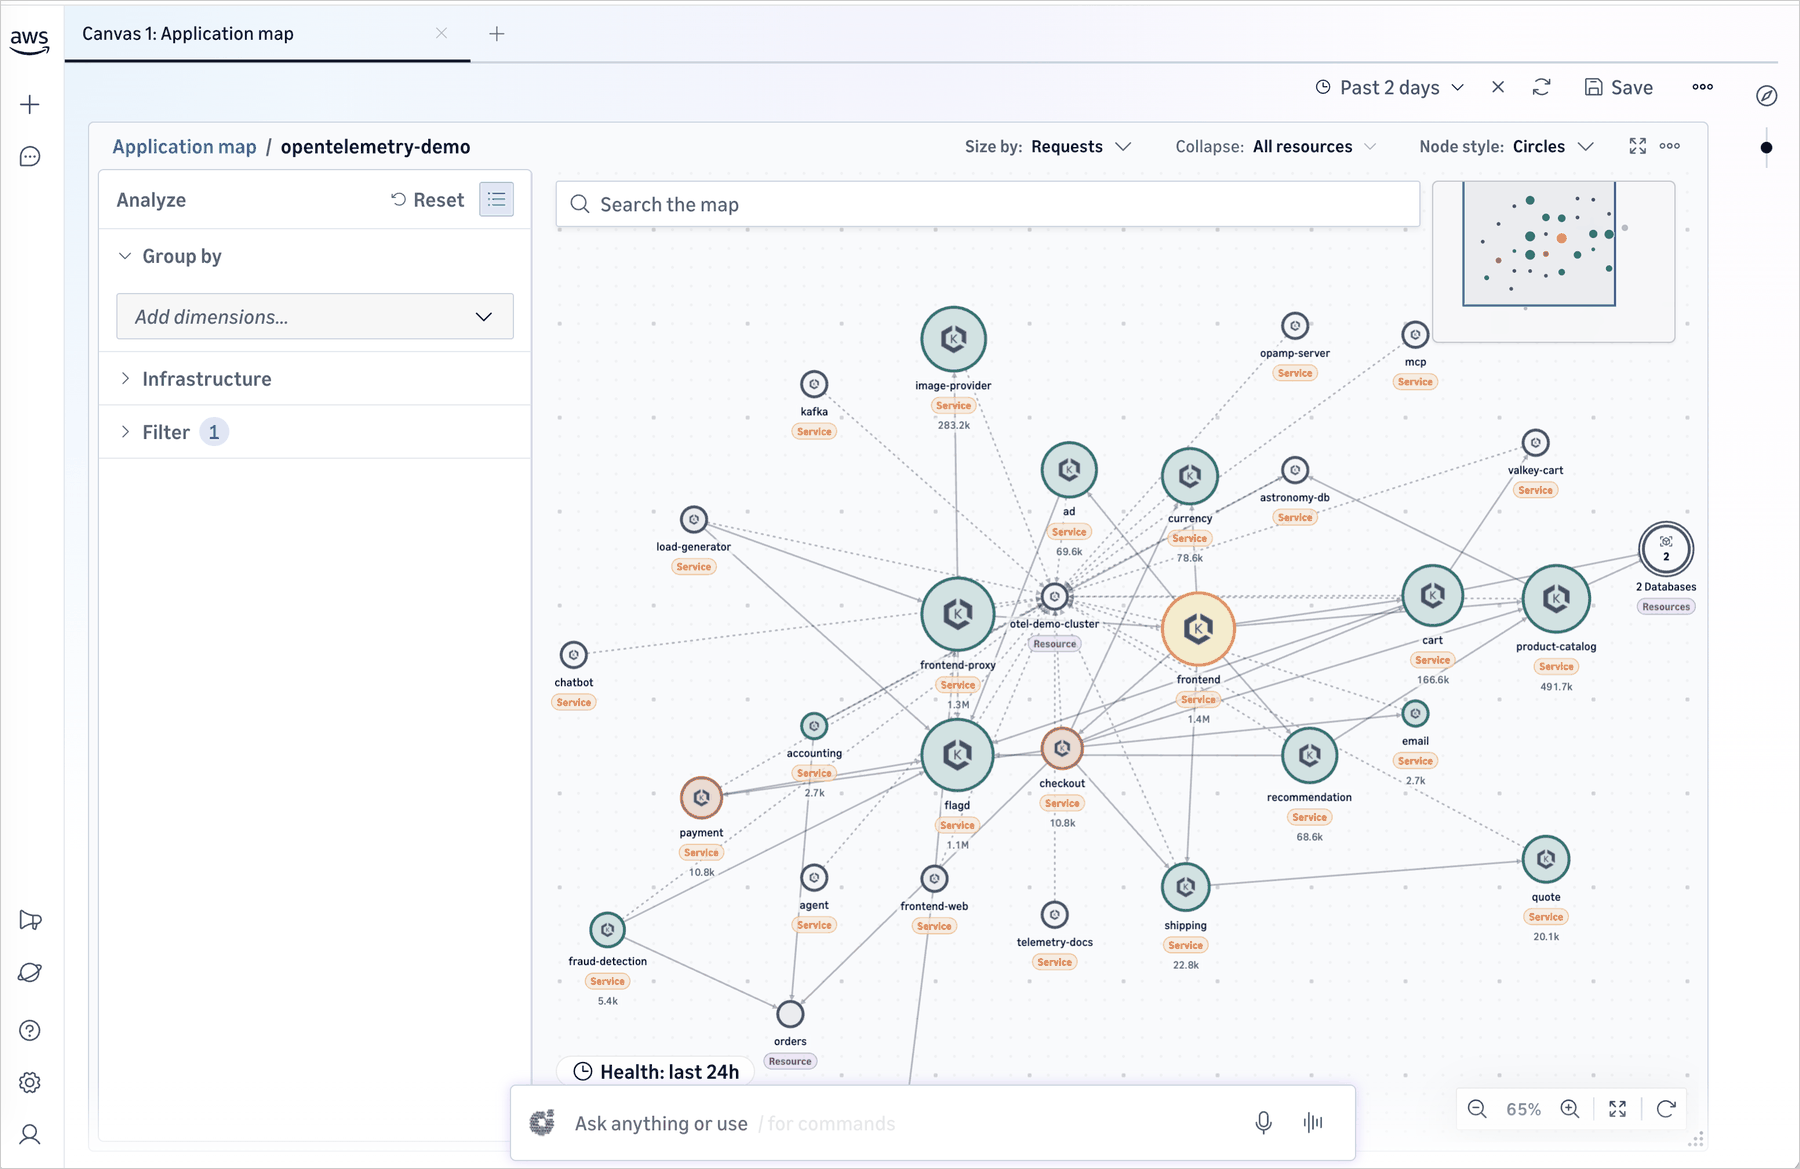
CloudWatch Omni obliterates this manual overhead through automated topology discovery. By continuously analyzing incoming OpenTelemetry data streams and integrating with AWS Config resource discovery, Omni automatically:
- Discovers services and maps complex inter-service dependencies in real time.
- Dynamically adjusts alarms based on declarations of what truly matters—such as availability targets, latency budgets, and error rate thresholds—rather than brittle, arbitrary metric thresholds.
- Automatically updates the application topology map the moment new services are deployed into production.
3. AI-Powered Investigations via Amazon DevOps Agent
Perhaps the most disruptive capability within CloudWatch Omni is the native integration of the Amazon DevOps Agent. Rather than acting as a passive alerting mechanism, the DevOps Agent participates actively alongside human engineers during live investigation sessions.
- Grounded Telemetry Analysis: Operating directly on the same OpenTelemetry data streams viewed by the human team, the agent correlates anomalous events across disparate services.
- Root-Cause Path Tracing: The agent analyzes dependency graphs to trace the exact propagation path of failures, instantly highlighting downstream impacts or upstream configuration drifts.
- Natural Language Querying: Engineers can interact with their telemetry data using plain English. Asking queries like "Show me all latency spikes in the checkout service that correlate with database connection pool exhaustion over the last two hours" yields immediate, synthesized analytical insights.
Official Statements and Architectural Breakdown
The architectural design of CloudWatch Omni was engineered to respect existing enterprise investments while eliminating data duplication and pipeline friction.
Zero Data Movement Architecture
A primary concern for enterprise platform engineering teams evaluating new observability tools is the cost and security risk of migrating historical telemetry data. AWS architected CloudWatch Omni to eliminate this barrier entirely. Omni operates as a management and visualization layer that points directly at existing Amazon CloudWatch data repositories (logs, metrics, traces, and alarms).
Furthermore, because Omni is built natively on OpenTelemetry, organizations that have already instrumented their workloads using OTel send their telemetry straight to standard OpenTelemetry Protocol (OTLP) endpoints. Existing monitoring setups require zero reconfiguration to begin leveraging Omni’s advanced spatial and analytical capabilities.
Multi-Environment Telemetry Ingestion
While deeply integrated with the AWS ecosystem, modern enterprise architectures are inherently hybrid and multi-cloud. CloudWatch Omni provides robust connectors that ingest telemetry from external environments—including on-premises data centers, private clouds, and competing public cloud providers. All ingested telemetry flows seamlessly alongside native AWS data within the same unified Spaces and investigation sessions.
Future Outlook: The Next Horizon of Autonomous Operations
The introduction of Amazon CloudWatch Omni signals a decisive milestone in the evolution of cloud computing: the transition from reactive monitoring to autonomous, agent-driven operations.
As generative AI agents transition from experimental utilities to core enterprise decision-makers handling customer transactions, financial routing, and automated code generation, the velocity of software systems will far exceed human cognitive capacity. Traditional dashboards and manual runbooks will become entirely obsolete in the face of hyper-distributed, autonomous architectures.
By pairing human engineering expertise with the real-time correlative power of the Amazon DevOps Agent within an application-centric, collaborative workspace, AWS has established a new gold standard for enterprise observability. For engineering organizations striving to tame the rising tide of cloud complexity, CloudWatch Omni offers a clear, scalable path toward resilient, self-diagnosing digital systems.
Getting Started with CloudWatch Omni
Deploying CloudWatch Omni across your enterprise requires minimal administrative overhead and can be accomplished in minutes:
- For Existing CloudWatch Customers: Simply log into the AWS Management Console, navigate to the Amazon CloudWatch console, and click "Try CloudWatch Omni." All existing logs, metrics, traces, and alarms will immediately populate within the new interface, allowing your teams to begin browsing application topologies and launching investigation sessions instantly.
- For Enterprise-Wide Deployment: Administrators can configure a dedicated domain, connect their corporate identity provider via IAM Identity Center (supporting Okta, Microsoft Entra ID, and other SAML 2.0 providers), define dedicated Spaces for specific teams and environments, and onboard users without granting broader AWS console credentials.
- Pricing and Availability: Amazon CloudWatch Omni is generally available now. Comprehensive pricing structures and tier breakdowns are available directly on the official Amazon CloudWatch Pricing Page.
To explore documentation, review regional availability, or test integration APIs using your preferred AI development tools, administrators can leverage the AWS MCP Server and associated plugins. Feedback and community discussions can be directed to AWS re:Post or managed through standard enterprise AWS Support channels.