
Executive Overview
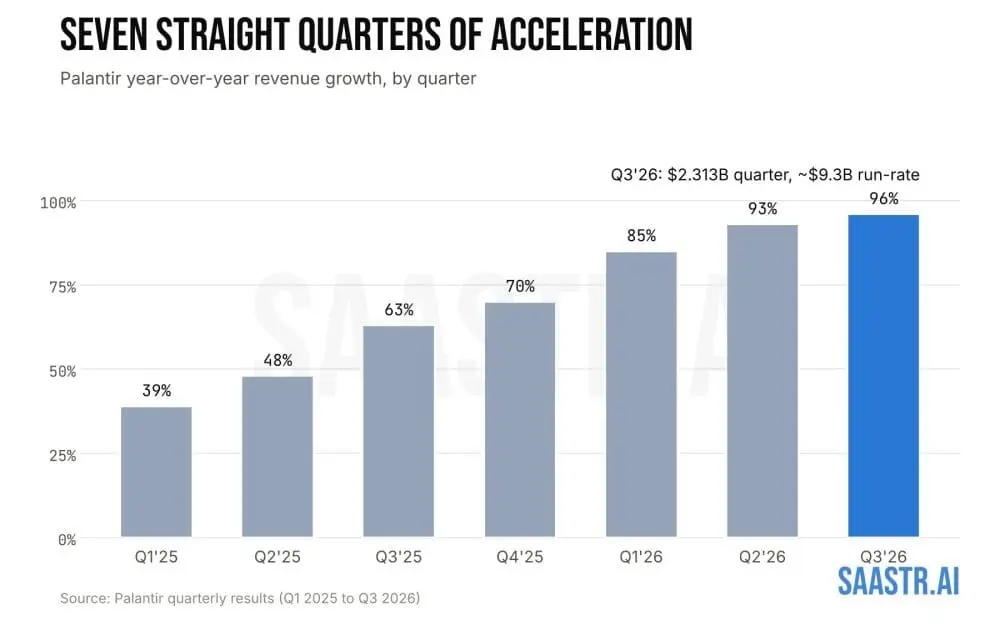
Palantir Technologies has delivered what is arguably one of the most astonishing financial quarters in the history of enterprise software. For the first time ever, the company’s quarterly revenue has shattered the $2 billion threshold, landing at $2.313 billion for the third quarter of fiscal 2026. This performance represents a staggering 96% year-over-year revenue increase and a 20% jump from the previous quarter alone. Propelled by this explosive momentum, Palantir’s annualized run-rate has climbed to approximately $9.3 billion, accelerating dramatically from the days when it scaled toward a $4 billion baseline.
Yet, despite obliterating Wall Street’s consensus expectations on top-line revenue and profitability, Palantir’s stock experienced downward pressure immediately following the report. Trading at roughly $172.99 post-print—down from $178.30 just hours prior—the market’s reaction underscores a classic Wall Street paradox: when a company is priced for perfection, even minor cracks in foundational metrics command intense scrutiny.
The source of investor hesitation does not lie in current execution, which remains virtually peerless, but rather in forward-looking indicators. While revenue, net retention rates, and operating margins reached historic highs, bookings metrics—specifically Total Contract Value (TCV) and Remaining Performance Obligation (RPO)—revealed sequential softening. Management attributes this divergence to a strategic shift toward shorter contract durations designed to accelerate closing times. As Palantir navigates this unprecedented growth phase, the coming quarters will test whether shorter initial commitments successfully translate into compounding enterprise expansions or introduce vulnerability to churn.
Detailed Chronology and Core Financial Performance
The narrative of Palantir’s Q3 2026 earnings can be parsed through five critical structural shifts that are reshaping the company’s identity, operational leverage, and geographic footprint.
1. U.S. Commercial Dominance: Passing the Government Sector
For the first two decades of its existence, Palantir was defined primarily as a defense and intelligence contractor that selectively marketed its software to commercial enterprises. Q3 2026 marked the definitive historical tipping point where that dynamic reversed.
U.S. commercial revenue skyrocketed by 148% year-over-year and 29% quarter-over-quarter, reaching $984 million. For comparison, the U.S. commercial segment generated just $764 million in Q2, meaning the company added roughly $220 million in quarterly revenue within a frantic 90-day window. To put this scale into perspective, the entire U.S. commercial division generated $397 million in a single quarter just one year prior; the single-quarter increase alone was more than half of the segment’s total output from a year ago.
Meanwhile, U.S. government revenue grew by a robust 96% year-over-year and 18% quarter-over-quarter to $953 million. While the government sector continues to expand at a pace most public tech firms would envy, it is now officially the slower-growing half of Palantir’s domestic business.
CEO Alex Karp highlighted this milestone during the earnings call, noting: "Our sequential growth in U.S. commercial of 29% would be an astonishing annual growth rate of any public software company in America." The strategic gamble taken years ago by Palantir’s founders—absorbing heavy criticism and burning capital to build out commercial sales teams and Artificial Intelligence Platform (AIP) bootcamps while government coffers were full—has finally materialized into a secondary engine compounding faster than the core.
2. High-Value Concentration: 686 Customers Driving Massive Expansion
Palantir continues to maintain a remarkably lean customer count relative to its multi-billion-dollar revenue base. Total U.S. commercial customers rose 29% year-over-year to 686. Dividing the $984 million quarterly U.S. commercial revenue by these 686 customers yields an average of roughly $1.43 million per customer per quarter, or approximately $5.7 million in annualized revenue per account.
Because customer counts grew by 29% while revenue surged by 148%, it is mathematically evident that the vast majority of growth is organic, driven by existing clients dramatically expanding their usage. This is further reflected in Palantir’s Net Dollar Retention (NRR) rate, which climbed 800 basis points quarter-over-quarter to reach an unprecedented 165%.
To observe NRR accelerating at scale is a rare phenomenon in enterprise SaaS. Palantir’s NRR stood at 134% a year ago, rose to 157% in the previous quarter, and now sits at 165%. During the earnings call, executives pointed to striking expansion examples, including one client that scaled its commitment from an initial pilot to $29 million within a 90-day span. Palantir’s go-to-market strategy relies on landing with paid, value-proving pilots before deploying its ontology-driven architecture to rapidly expand deployment breadth.
3. The Bookings Paradox: TCV Growth Cools Despite Record Top-Line
The primary catalyst for the stock’s post-earnings pullback was found in the bookings data. Palantir closed total TCV of $2.918 billion, marking a modest 6% increase year-over-year. Within that figure, U.S. commercial TCV stood at $1.463 billion, up 11% year-over-year, while U.S. commercial Remaining Deal Value (RDV) reached $6.517 billion—up 79% year-over-year but creeping up just 4% sequentially. Furthermore, total Remaining Performance Obligation (RPO) plateaued sequentially at $4.9 billion.
This represents a notable deceleration from Q2, when Palantir closed $2.132 billion in U.S. commercial TCV (up 153% year-over-year and 81% sequentially). In Q3, U.S. commercial TCV dropped from $2.13 billion down to $1.46 billion over 90 days, even as revenue grew 148%.
CFO Dave Glazer clarified that this gap is primarily a function of contract structuring. Newer eight-figure deals are being executed with shorter durations than historical agreements, which accelerates revenue recognition while suppressing headline TCV and RPO metrics. Management maintains that contract sizes and durations will naturally lengthen as clients mature in harvesting enterprise value from their deployments. However, the inherent risk of shorter contract lengths is that it provides customers with more frequent off-ramps, putting intense pressure on Q4 and Q1 renewals to prove long-term stickiness.
4. Operational Leverage: Historic Margins and Financial Strength
Palantir’s financial discipline during this period of hyper-growth remains extraordinary. The company reported adjusted income from operations of $1.427 billion, translating to an astonishing 62% adjusted operating margin, up from 51% in the prior-year period. Combined with 96% revenue growth, Palantir’s Rule of 40 score hit an elite 158—far surpassing the standard 40% benchmark.
GAAP performance mirrored this strength. GAAP income from operations reached $1.085 billion (a 47% margin), and GAAP net income hit $1.128 billion (a 49% margin). Stock-based compensation was contained at $319 million for the quarter, representing roughly 14% of revenue—considerably lower than industry norms for high-growth software firms.
Total operating expenses grew at roughly half the rate of revenue, with non-GAAP adjusted expenses rising 53% year-over-year to $887 million. Management noted that internal capacity currently falls short of surging market demand; rather than hiring aggressively to bloat headcount, Palantir is relying on AIP and its foundational ontology layer to scale each deployment efficiently.
5. Geographic Divergence: International Commercial Stagnates
Palantir’s international operations exposed a sharp contrast to its domestic dominance. International commercial revenue grew 21% year-over-year but inched up just 1% sequentially to $184 million. International government revenue fared slightly better, up 31% year-over-year to $192 million.
Consequently, the United States now accounts for $1.937 billion of Palantir’s $2.313 billion quarterly revenue—representing 84% of the entire business. While management has long noted that European enterprise markets exhibit slower adoption cycles, the company has elected not to force resources abroad. Capital and engineering talent are being concentrated where buyers are executing deals immediately.
Supporting Context & Metrics Summary
To contextualize Palantir’s current financial standing, the key performance indicators from Q3 2026 can be synthesized as follows:
- Total Revenue: $2.313 billion (up 96% YoY, up 20% QoQ).
- Annualized Run-Rate: ~$9.3 billion.
- U.S. Commercial Revenue: $984 million (up 148% YoY, up 29% QoQ).
- U.S. Government Revenue: $953 million (up 96% YoY, up 18% QoQ).
- Net Dollar Retention (NRR): 165% (up 800 bps QoQ).
- U.S. Commercial Customer Count: 686 customers (up 29% YoY), with average annualized revenue per customer running at ~$5.7 million.
- Total Contract Value (TCV) Bookings: $2.918 billion (up 6% YoY).
- Adjusted Operating Margin: 62% ($1.427 billion adjusted operating income).
- GAAP Net Income: $1.128 billion (49% net margin).
- Balance Sheet: $10.4 billion in cash, cash equivalents, and U.S. Treasury securities.
Official Statements and Management Commentary
Addressing financial analysts and shareholders, CEO Alex Karp emphasized the paradigm-shifting nature of Palantir’s AI deployments through AIP. Karp noted that the speed at which enterprises are integrating Palantir’s software into core operational workflows is fundamentally altering traditional software procurement cycles.
CFO Dave Glazer addressed the cooling bookings numbers directly, reassuring the market that the deceleration in TCV growth is an artifact of strategic contract duration choices rather than waning customer demand. Glazer explained: "As customers realize value faster, they are eager to operationalize deployments quickly, which at times leads to shorter initial contract lengths. We view this as a healthy evolution of our sales velocity, supported by billings growth of 114% year-over-year to $2.39 billion."
Future Outlook: What Q4 and Beyond Must Prove
Palantir enters the final stretch of fiscal 2026 riding an unprecedented wave of operational excellence. With $10.4 billion in cash and short-term treasuries, a Rule of 40 score of 158, and a GAAP net income margin hovering near 50%, the company’s financial foundation is ironclad.
However, the market’s muted reaction to a historic quarter signals a clear directive for management. At a market capitalization exceeding $420 billion—representing roughly 46x forward run-rate revenue—perfection is priced in. To restore upward momentum to the stock, Palantir must demonstrate in Q4 and Q1 that the shorter contracts executed in Q3 successfully convert into high-value renewals and expansions. If pilot conversions continue to scale into multi-million-dollar deployments—such as the recent expansions from $3 million to $29 million—the current dip in bookings will be viewed in hindsight as a temporary optical illusion masking a compounding enterprise titan.